On-Call Runbook Skill
Write an on-call runbook for a service — covering alert definitions, escalation paths, common incident responses, and on-call handoff procedures.
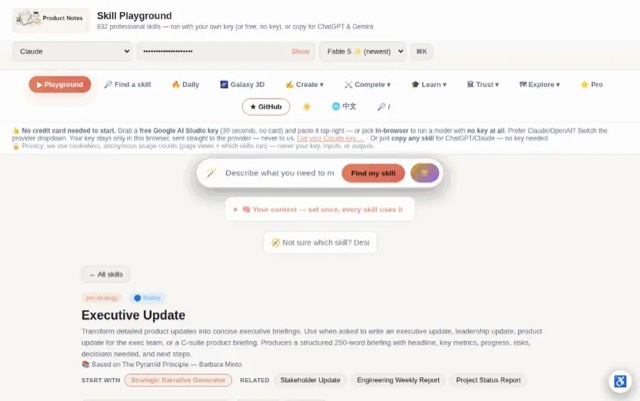
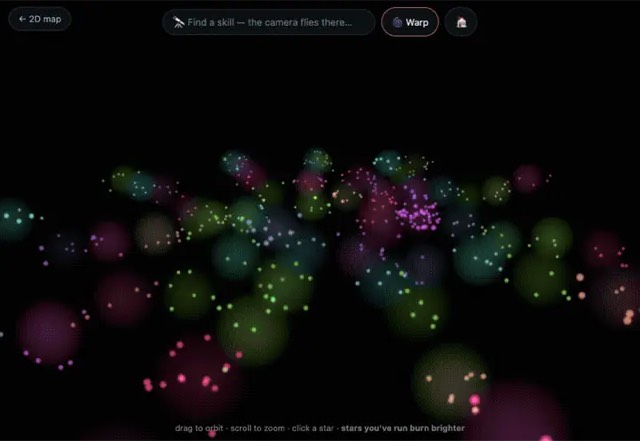
From the mohitagw15856/pm-claude-skills README — shows the whole collection, not only this skill. · view on GitHub
How to use it
Claude Code
- Run the line below. It pulls the whole folder into
~/.claude/skills/oncall-runbook. - Describe your job in plain words. Claude Code follows the skill from there.
npx degit mohitagw15856/pm-claude-skills/skills/oncall-runbook#main ~/.claude/skills/oncall-runbookFor one project only, change the path to .claude/skills/oncall-runbook.
Claude (web or desktop app)
- On this page open ⋯ → Download .md.
- Save it as SKILL.md in a folder, zip the folder, then Customize → Skills → + → Create skill → Upload a skill.
- Pick the file and Save. Claude shows the name and description and runs a security scan.
- Check the skill is switched on.
- Start a new chat and describe your job in plain words. The AI follows the skill from there.
ChatGPT or another app
- ChatGPT: make a Project and paste it into Instructions.
- Neither? Paste it at the top of a new chat — it works for that chat.
Not working?
- Check which app you pasted it into — the steps above name the right one.
- Some skills need the paid tier of Claude or ChatGPT.
Paste into Claude, ChatGPT or Cursor.
Source of On-Call Runbook Skill
Show the full text409 lines
| name | description |
|---|---|
| oncall-runbook | Write an on-call runbook for a service — covering alert definitions, escalation paths, common incident responses, and on-call handoff procedures. Use when asked to write an on-call guide, create alert runbooks, document escalation procedures, or prepare an on-call handoff document. Produces a structured on-call runbook with per-alert response procedures, escalation matrix, diagnostic commands, and handoff template. |
On-Call Runbook Skill
Produce a complete on-call runbook for a service — giving the on-call engineer everything they need to respond confidently to alerts at 3am, without having to ask anyone for help.
A good on-call runbook reduces mean time to resolution (MTTR) by eliminating the "what do I do first?" problem. It is written for the on-call engineer who has just been paged and needs to act, not for someone calmly reading documentation.
Where this sits — the spine's terminus
Last in the incident-response spine: /slo-error-budget (frame) →
/debugging-log-analyser → /incident-postmortem → oncall-runbook. It receives the
contributing factors and action items from /incident-postmortem and turns the
detection/mitigation learnings into an entry that makes the next responder minutes, not
hours — closing the loop so the same incident doesn't recur at full cost. Runbook entry,
detection/mitigation time, and the loop are defined once in
docs/craft/incident-response.md.
The loop
A runbook fails when it's written for a calm reader instead of a paged one at 3am. Phase 1 sets the audience; every later choice serves it.
- Write for the paged engineer, not the documentarian. The reader has just been woken and needs to act — so lead with the fastest safe mitigation, put copy-pasteable commands first, and defer background. Prose that explains before it acts fails at 3am. Done when: each alert's entry lets a non-expert take the first safe action within a minute of opening it, without reading theory.
- Turn postmortem learnings into per-alert procedures. For each known failure (the incident-postmortem's are the highest-value), write detect → mitigate → escalate: the exact checks, the copy-pasteable commands, the rollback, and when to page whom. Done when: every alert maps to a procedure with concrete commands and a clear mitigation, not just "investigate."
- Make escalation and handoff unambiguous. Who to page, when, and how to hand off mid-incident — because the second failure mode after "what do I do?" is "who do I wake, and when is it okay to?" Done when: the escalation matrix names people/rotations and the trigger for each, and the handoff template captures state so the next responder isn't starting cold.
- Close the loop back to prevention. Flag where a runbook step reveals a gap that
should become monitoring or an
/slo-error-budgetaction — the runbook is where the loop's learnings surface the next prevention. Done when: gaps found while writing the runbook are logged as detection/prevention improvements, not silently absorbed.
Required Inputs
Ask for these if not already provided:
- Service name and what it does
- Team and tech lead name
- Alert list — names of alerts that currently page on-call
- Monitoring setup — Datadog / Grafana / CloudWatch / PagerDuty / etc.
- Common failure modes — what breaks most often, and what fixes it
- Escalation contacts — who to call when on-call can't resolve it
- Deployment setup — can on-call roll back? How?
- Service dependencies — what does this service depend on, and what depends on it?
Output Format
On-Call Runbook: [Service Name]
Team: [Team name] | Tech lead: [Name] PagerDuty service: [Link] | Escalation policy: [Policy name] Last updated: [Date] | Next review: [Date + 90 days]
First time on-call for this service? Read the [developer onboarding doc] first — it covers the architecture and how things work. This runbook assumes you understand the service.
Quick Reference
Dashboard: [Link — the first thing to open when paged] Logs: [Link — where to find logs] Runbook index: Jump to the alert that paged you → [Alert list below] Can't resolve in 30 min? Escalate to: [Name] via [Slack / PagerDuty]
Rollback command (memorise this):
[rollback command — e.g. kubectl rollout undo deployment/[service-name]]
Escalation Matrix
| Situation | Escalate to | How | After how long |
|---|---|---|---|
| Can't diagnose the alert | [Tech lead name] | Slack DM / Phone | 30 minutes |
| Alert requires infra change | [Platform team] | #platform Slack |
Immediately |
| Customer-facing impact | [CSM / Support lead] | #incidents Slack |
Immediately (P1) |
| Database issue | [DBA or data team] | Slack / PagerDuty | Immediately |
| [Specific dependency] down | [[Dependency] on-call] | PagerDuty / Slack | Immediately |
| Extended outage (>1 hour) | [Engineering manager] | Phone | 1 hour |
Contacts:
| Name | Role | Slack | Phone |
|---|---|---|---|
| [Name] | Tech lead | @[handle] | [Number] |
| [Name] | Engineering manager | @[handle] | [Number] |
| [Name] | Platform / infra | @[handle] | [Number] |
| [Platform team] | Infra on-call | #platform |
PagerDuty |
Service Architecture (Quick View)
[Upstream callers]
        │
        ▼
[This Service]
        │
        ├──→ [Primary Database]
        ├──→ [Cache — e.g. Redis]
        └──→ [Downstream Service / Queue]
If this service is down, these are affected: [List downstream consumers] If these are down, this service is affected: [List upstream dependencies]
Alert Runbooks
ALERT: [Alert Name 1 — e.g. HighErrorRate]
What it means: [Plain English — e.g. "More than 5% of API requests are returning 5xx errors in the last 5 minutes"] Severity: P1 / P2 / P3 SLO impact: Yes / No — [If yes: this alert means the error budget is burning at [X]× rate]
Step 1 — Acknowledge and assess
# Check current error rate
[query or dashboard link]

# Check which endpoints are erroring
[query or command]
Step 2 — Check recent changes
# Any deploys in the last hour?
[command or link to deployment log]

# Recent config changes?
[where to check]
Step 3 — Check dependencies
# Is the database healthy?
[health check command or link]

# Is [downstream service] healthy?
[health check command or link]
Step 4 — Diagnose
| If you see | It means | Do this |
|---|---|---|
| [Error pattern 1] | [Cause] | [Action] |
| [Error pattern 2] | [Cause] | [Action] |
| [Error pattern 3] | [Cause] | [Action] |
| No clear pattern | Unknown cause | Escalate to [name] |
Step 5 — Fix or mitigate
# If caused by bad deploy — roll back:
[rollback command]

# If caused by [specific issue]:
[fix command]

# If caused by upstream dependency:
[mitigation — e.g. enable circuit breaker, reduce traffic, etc.]
After resolving:
- Confirm error rate has returned to baseline
- Check no downstream services were affected
- If P1: open a post-incident review — see [incident-postmortem skill]
- Update
#incidentswith resolution summary
ALERT: [Alert Name 2 — e.g. HighLatency]
What it means: [e.g. "P99 response time has exceeded 1s for more than 3 consecutive minutes"] Severity: P1 / P2 / P3 SLO impact: Yes — latency SLO breach
Step 1 — Assess scope
# Check which endpoints are slow
[query or dashboard — broken down by endpoint]

# Check if latency is across all regions or localised
[query or command]
Step 2 — Common causes and fixes
| Cause | Signal | Fix |
|---|---|---|
| Database slow queries | DB latency spike on dashboard | [Check slow query log: command] |
| Cache miss storm | Cache hit rate drops on dashboard | [command or action] |
| Memory pressure / GC | High memory on service dashboard | [command or action — e.g. restart, scale up] |
| Upstream service slow | Trace shows time in external call | Escalate to [service] on-call |
| Traffic spike | Request rate spike on dashboard | [Scale up: command] |
Step 3 — Escalate if unresolved in 20 minutes Page [Tech lead] via PagerDuty / Slack.
ALERT: [Alert Name 3 — e.g. DatabaseConnectionPoolExhausted]
What it means: [e.g. "The service has used all available database connections — new requests will fail"] Severity: P1 SLO impact: Yes — will cause errors immediately
Immediate mitigation:
# Restart the service to flush stale connections
[restart command]

# Check current connection count
[DB connection query]
Diagnose root cause after stabilising:
# Check for long-running queries holding connections
[query]

# Check if a recent deploy changed connection pool config
[where to check]
Resolution: [e.g. "Increase pool size in config / kill long-running queries / scale the service"]
ALERT: [Alert Name 4 — e.g. QueueBacklogHigh / ConsumerLag]
What it means: [e.g. "The message queue backlog exceeds 10,000 messages — consumers are not keeping up"] Severity: P2 SLO impact: Depends — if queue backs up, downstream systems will receive delayed data
Step 1 — Check consumer health
# Are consumers running?
[command]

# Consumer error rate?
[dashboard or query]
Step 2 — Check message contents
# Are there poison messages causing retries?
[command to inspect dead-letter queue or failed messages]
Step 3 — Options
| If | Then |
|---|---|
| Consumers are down | Restart consumers: [command] |
| Poison message in queue | Move to DLQ: [command] |
| Consumers healthy but slow | Scale consumers: [command] |
| Upstream producing too fast | Escalate to [upstream service] owner |
ALERT: [Add additional alerts following the same pattern]
Diagnostic Cheat Sheet
Common commands for quick diagnosis. Paste and run without modification.
# Service health
[health check command]

# Recent logs (last 100 lines)
[log command]

# Error logs only
[error log filter command]

# Current pod / instance status
[kubectl get pods / aws ecs describe-tasks / etc.]

# Restart the service
[restart command]

# Roll back to previous version
[rollback command]

# Database connection count
[DB query]

# Cache hit rate
[cache stats command]

# Current request rate
[metrics query]
Useful Dashboard Links
| Dashboard | URL | Use it to |
|---|---|---|
| Service overview | [Link] | First stop — error rate, latency, request rate |
| Database | [Link] | Connection count, slow queries, replication lag |
| Infrastructure | [Link] | CPU, memory, disk |
| Queue / consumers | [Link] | Backlog depth, consumer throughput |
| Upstream dependencies | [Link] | Dependency health at a glance |
Incident Communication
When you declare an incident:
Post to #incidents immediately:
🔴 INCIDENT — [Service Name]
Status: Investigating
Impact: [Who is affected and how]
Paged: [Your name]
Next update: [Time — max 30 min from now]
Update every 30 minutes while active:
🔴 UPDATE — [Service Name] — [Time]
Status: [Investigating / Identified / Mitigating / Resolved]
Latest: [One sentence on what you found or did]
Next update: [Time]
On resolution:
✅ RESOLVED — [Service Name] — [Time]
Duration: [X minutes]
Impact: [Summary of who was affected]
Cause: [One sentence]
Follow-up: [PIR required? Yes/No — link when created]
On-Call Handoff
Use this template at the end of every on-call shift:
--- ON-CALL HANDOFF: [Service Name] ---
Date: [Date]
Outgoing: [Your name]
Incoming: [Next on-call name]

INCIDENTS THIS SHIFT:
- [Incident summary — date, duration, cause, resolution, follow-up required]

OPEN ISSUES TO WATCH:
- [Anything not fully resolved / trending in the wrong direction]

CHANGES SINCE LAST HANDOFF:
- [Deploys, config changes, infra changes that affect on-call awareness]

RUNBOOK GAPS FOUND:
- [Anything you had to figure out that isn't documented — please add it]

ANYTHING ELSE:
- [Notes for incoming on-call]
Quality Checks
- Every alert that pages on-call has a runbook entry — no alert is missing
- Rollback command is accurate and tested recently
- Escalation contacts have current phone numbers and Slack handles
- Diagnostic commands work — they have been run by at least one person recently
- Handoff template is used at every shift change — not just during incidents
- "Things I had to figure out that weren't documented" are added to this runbook after every incident
Anti-Patterns
- Do not write alert runbooks with vague diagnostic steps like "check the logs" — every step must specify the exact command, dashboard link, or query to run
- Do not include an alert in the runbook that has no specific on-call action — an alert that pages someone with no defined response path creates panic, not resolution
- Do not leave the rollback command undocumented or untested — a rollback procedure that has never been run will fail when needed most
- Do not list escalation contacts without phone numbers and Slack handles — email-only escalation paths are useless during a 3am incident
- Do not write the runbook once and treat it as permanent — runbooks go stale after incidents; every incident must trigger a review of the relevant runbook entries
| 1 | |
| 2 | name oncall-runbook |
| 3 | description "Write an on-call runbook for a service — covering alert definitions, escalation paths, common incident responses, and on-call handoff procedures. Use when asked to write an on-call guide, create alert runbooks, document escalation procedures, or prepare an on-call handoff document. Produces a structured on-call runbook with per-alert response procedures, escalation matrix, diagnostic commands, and handoff template." |
| 4 | |
| 5 | |
| 6 | # On-Call Runbook Skill |
| 7 | |
| 8 | Produce a complete on-call runbook for a service — giving the on-call engineer everything they need to respond confidently to alerts at 3am, without having to ask anyone for help. |
| 9 | |
| 10 | A good on-call runbook reduces mean time to resolution (MTTR) by eliminating the "what do I do first?" problem. It is written for the on-call engineer who has just been paged and needs to act, not for someone calmly reading documentation. |
| 11 | |
| 12 | ## Where this sits — the spine's terminus |
| 13 | |
| 14 | Last in the incident-response spine: **`/slo-error-budget` (frame) → |
| 15 | `/debugging-log-analyser` → `/incident-postmortem` → `oncall-runbook`**. It receives the |
| 16 | **contributing factors and action items** from `/incident-postmortem` and turns the |
| 17 | detection/mitigation learnings into an entry that makes the *next* responder minutes, not |
| 18 | hours — closing the loop so the same incident doesn't recur at full cost. *Runbook entry*, |
| 19 | *detection/mitigation time*, and the loop are defined once in |
| 20 | [`docs/craft/incident-response.md`]. |
| 21 | |
| 22 | ## The loop |
| 23 | |
| 24 | A runbook fails when it's written for a calm reader instead of a paged one at 3am. |
| 25 | Phase 1 sets the audience; every later choice serves it. |
| 26 | |
| 27 | **Write for the paged engineer, not the documentarian.** The reader has just been |
| 28 | woken and needs to *act* — so lead with the fastest safe mitigation, put copy-pasteable |
| 29 | commands first, and defer background. Prose that explains before it acts fails at 3am. |
| 30 | **Done when:** each alert's entry lets a non-expert take the first safe action within a |
| 31 | minute of opening it, without reading theory. |
| 32 | **Turn postmortem learnings into per-alert procedures.** For each known failure (the |
| 33 | incident-postmortem's are the highest-value), write detect → mitigate → escalate: |
| 34 | the exact checks, the copy-pasteable commands, the rollback, and when to page whom. |
| 35 | **Done when:** every alert maps to a procedure with concrete commands and a clear |
| 36 | mitigation, not just "investigate." |
| 37 | **Make escalation and handoff unambiguous.** Who to page, when, and how to hand off |
| 38 | mid-incident — because the second failure mode after "what do I do?" is "who do I |
| 39 | wake, and when is it okay to?" |
| 40 | **Done when:** the escalation matrix names people/rotations and the trigger for each, |
| 41 | and the handoff template captures state so the next responder isn't starting cold. |
| 42 | **Close the loop back to prevention.** Flag where a runbook step reveals a gap that |
| 43 | should become monitoring or an `/slo-error-budget` action — the runbook is where the |
| 44 | loop's learnings surface the next prevention. |
| 45 | **Done when:** gaps found while writing the runbook are logged as detection/prevention |
| 46 | improvements, not silently absorbed. |
| 47 | |
| 48 | ## Required Inputs |
| 49 | |
| 50 | Ask for these if not already provided: |
| 51 | **Service name** and what it does |
| 52 | **Team** and tech lead name |
| 53 | **Alert list** — names of alerts that currently page on-call |
| 54 | **Monitoring setup** — Datadog / Grafana / CloudWatch / PagerDuty / etc. |
| 55 | **Common failure modes** — what breaks most often, and what fixes it |
| 56 | **Escalation contacts** — who to call when on-call can't resolve it |
| 57 | **Deployment setup** — can on-call roll back? How? |
| 58 | **Service dependencies** — what does this service depend on, and what depends on it? |
| 59 | |
| 60 | ## Output Format |
| 61 | |
| 62 | |
| 63 | |
| 64 | # On-Call Runbook: [Service Name] |
| 65 | |
| 66 | **Team:** [Team name] | **Tech lead:** [Name] |
| 67 | **PagerDuty service:** [Link] | **Escalation policy:** [Policy name] |
| 68 | **Last updated:** [Date] | **Next review:** [Date + 90 days] |
| 69 | |
| 70 | > **First time on-call for this service?** Read the [developer onboarding doc] first — it covers the architecture and how things work. This runbook assumes you understand the service. |
| 71 | |
| 72 | |
| 73 | |
| 74 | ## Quick Reference |
| 75 | |
| 76 | **Dashboard:** [Link — the first thing to open when paged] |
| 77 | **Logs:** [Link — where to find logs] |
| 78 | **Runbook index:** Jump to the alert that paged you → [Alert list below] |
| 79 | **Can't resolve in 30 min?** Escalate to: [Name] via [Slack / PagerDuty] |
| 80 | |
| 81 | **Rollback command (memorise this):** |
| 82 | |
| 83 | [rollback command — e.g. kubectl rollout undo deployment/[service-name]] |
| 84 | |
| 85 | |
| 86 | |
| 87 | |
| 88 | ## Escalation Matrix |
| 89 | |
| 90 | | Situation | Escalate to | How | After how long | |
| 91 | |---|---|---|---| |
| 92 | | Can't diagnose the alert | [Tech lead name] | Slack DM / Phone | 30 minutes | |
| 93 | | Alert requires infra change | [Platform team] | `#platform` Slack | Immediately | |
| 94 | | Customer-facing impact | [CSM / Support lead] | `#incidents` Slack | Immediately (P1) | |
| 95 | | Database issue | [DBA or data team] | Slack / PagerDuty | Immediately | |
| 96 | | [Specific dependency] down | [[Dependency] on-call] | PagerDuty / Slack | Immediately | |
| 97 | | Extended outage (>1 hour) | [Engineering manager] | Phone | 1 hour | |
| 98 | |
| 99 | **Contacts:** |
| 100 | |
| 101 | | Name | Role | Slack | Phone | |
| 102 | |---|---|---|---| |
| 103 | | [Name] | Tech lead | @[handle] | [Number] | |
| 104 | | [Name] | Engineering manager | @[handle] | [Number] | |
| 105 | | [Name] | Platform / infra | @[handle] | [Number] | |
| 106 | | [Platform team] | Infra on-call | `#platform` | PagerDuty | |
| 107 | |
| 108 | |
| 109 | |
| 110 | ## Service Architecture (Quick View) |
| 111 | |
| 112 | |
| 113 | [Upstream callers] |
| 114 | │ |
| 115 | ▼ |
| 116 | [This Service] |
| 117 | │ |
| 118 | ├──→ [Primary Database] |
| 119 | ├──→ [Cache — e.g. Redis] |
| 120 | └──→ [Downstream Service / Queue] |
| 121 | |
| 122 | |
| 123 | **If this service is down, these are affected:** [List downstream consumers] |
| 124 | **If these are down, this service is affected:** [List upstream dependencies] |
| 125 | |
| 126 | |
| 127 | |
| 128 | ## Alert Runbooks |
| 129 | |
| 130 | ### ALERT: [Alert Name 1 — e.g. HighErrorRate] |
| 131 | |
| 132 | **What it means:** [Plain English — e.g. "More than 5% of API requests are returning 5xx errors in the last 5 minutes"] |
| 133 | **Severity:** P1 / P2 / P3 |
| 134 | **SLO impact:** Yes / No — [If yes: this alert means the error budget is burning at [X]× rate] |
| 135 | |
| 136 | **Step 1 — Acknowledge and assess** |
| 137 | |
| 138 | # Check current error rate |
| 139 | [query or dashboard link] |
| 140 | |
| 141 | # Check which endpoints are erroring |
| 142 | [query or command] |
| 143 | |
| 144 | |
| 145 | **Step 2 — Check recent changes** |
| 146 | |
| 147 | # Any deploys in the last hour? |
| 148 | [command or link to deployment log] |
| 149 | |
| 150 | # Recent config changes? |
| 151 | [where to check] |
| 152 | |
| 153 | |
| 154 | **Step 3 — Check dependencies** |
| 155 | |
| 156 | # Is the database healthy? |
| 157 | [health check command or link] |
| 158 | |
| 159 | # Is [downstream service] healthy? |
| 160 | [health check command or link] |
| 161 | |
| 162 | |
| 163 | **Step 4 — Diagnose** |
| 164 | |
| 165 | | If you see | It means | Do this | |
| 166 | |---|---|---| |
| 167 | | [Error pattern 1] | [Cause] | [Action] | |
| 168 | | [Error pattern 2] | [Cause] | [Action] | |
| 169 | | [Error pattern 3] | [Cause] | [Action] | |
| 170 | | No clear pattern | Unknown cause | Escalate to [name] | |
| 171 | |
| 172 | **Step 5 — Fix or mitigate** |
| 173 | |
| 174 | # If caused by bad deploy — roll back: |
| 175 | [rollback command] |
| 176 | |
| 177 | # If caused by [specific issue]: |
| 178 | [fix command] |
| 179 | |
| 180 | # If caused by upstream dependency: |
| 181 | [mitigation — e.g. enable circuit breaker, reduce traffic, etc.] |
| 182 | |
| 183 | |
| 184 | **After resolving:** |
| 185 | [ ] Confirm error rate has returned to baseline |
| 186 | [ ] Check no downstream services were affected |
| 187 | [ ] If P1: open a post-incident review — see [incident-postmortem skill] |
| 188 | [ ] Update `#incidents` with resolution summary |
| 189 | |
| 190 | |
| 191 | |
| 192 | ### ALERT: [Alert Name 2 — e.g. HighLatency] |
| 193 | |
| 194 | **What it means:** [e.g. "P99 response time has exceeded 1s for more than 3 consecutive minutes"] |
| 195 | **Severity:** P1 / P2 / P3 |
| 196 | **SLO impact:** Yes — latency SLO breach |
| 197 | |
| 198 | **Step 1 — Assess scope** |
| 199 | |
| 200 | # Check which endpoints are slow |
| 201 | [query or dashboard — broken down by endpoint] |
| 202 | |
| 203 | # Check if latency is across all regions or localised |
| 204 | [query or command] |
| 205 | |
| 206 | |
| 207 | **Step 2 — Common causes and fixes** |
| 208 | |
| 209 | | Cause | Signal | Fix | |
| 210 | |---|---|---| |
| 211 | | Database slow queries | DB latency spike on dashboard | [Check slow query log: `command`] | |
| 212 | | Cache miss storm | Cache hit rate drops on dashboard | [command or action] | |
| 213 | | Memory pressure / GC | High memory on service dashboard | [command or action — e.g. restart, scale up] | |
| 214 | | Upstream service slow | Trace shows time in external call | Escalate to [service] on-call | |
| 215 | | Traffic spike | Request rate spike on dashboard | [Scale up: `command`] | |
| 216 | |
| 217 | **Step 3 — Escalate if unresolved in 20 minutes** |
| 218 | Page [Tech lead] via PagerDuty / Slack. |
| 219 | |
| 220 | |
| 221 | |
| 222 | ### ALERT: [Alert Name 3 — e.g. DatabaseConnectionPoolExhausted] |
| 223 | |
| 224 | **What it means:** [e.g. "The service has used all available database connections — new requests will fail"] |
| 225 | **Severity:** P1 |
| 226 | **SLO impact:** Yes — will cause errors immediately |
| 227 | |
| 228 | **Immediate mitigation:** |
| 229 | |
| 230 | # Restart the service to flush stale connections |
| 231 | [restart command] |
| 232 | |
| 233 | # Check current connection count |
| 234 | [DB connection query] |
| 235 | |
| 236 | |
| 237 | **Diagnose root cause after stabilising:** |
| 238 | |
| 239 | # Check for long-running queries holding connections |
| 240 | [query] |
| 241 | |
| 242 | # Check if a recent deploy changed connection pool config |
| 243 | [where to check] |
| 244 | |
| 245 | |
| 246 | **Resolution:** [e.g. "Increase pool size in config / kill long-running queries / scale the service"] |
| 247 | |
| 248 | |
| 249 | |
| 250 | ### ALERT: [Alert Name 4 — e.g. QueueBacklogHigh / ConsumerLag] |
| 251 | |
| 252 | **What it means:** [e.g. "The message queue backlog exceeds 10,000 messages — consumers are not keeping up"] |
| 253 | **Severity:** P2 |
| 254 | **SLO impact:** Depends — if queue backs up, downstream systems will receive delayed data |
| 255 | |
| 256 | **Step 1 — Check consumer health** |
| 257 | |
| 258 | # Are consumers running? |
| 259 | [command] |
| 260 | |
| 261 | # Consumer error rate? |
| 262 | [dashboard or query] |
| 263 | |
| 264 | |
| 265 | **Step 2 — Check message contents** |
| 266 | |
| 267 | # Are there poison messages causing retries? |
| 268 | [command to inspect dead-letter queue or failed messages] |
| 269 | |
| 270 | |
| 271 | **Step 3 — Options** |
| 272 | |
| 273 | | If | Then | |
| 274 | |---|---| |
| 275 | | Consumers are down | Restart consumers: `[command]` | |
| 276 | | Poison message in queue | Move to DLQ: `[command]` | |
| 277 | | Consumers healthy but slow | Scale consumers: `[command]` | |
| 278 | | Upstream producing too fast | Escalate to [upstream service] owner | |
| 279 | |
| 280 | |
| 281 | |
| 282 | ### ALERT: [Add additional alerts following the same pattern] |
| 283 | |
| 284 | |
| 285 | |
| 286 | ## Diagnostic Cheat Sheet |
| 287 | |
| 288 | Common commands for quick diagnosis. Paste and run without modification. |
| 289 | |
| 290 | |
| 291 | # Service health |
| 292 | [health check command] |
| 293 | |
| 294 | # Recent logs (last 100 lines) |
| 295 | [log command] |
| 296 | |
| 297 | # Error logs only |
| 298 | [error log filter command] |
| 299 | |
| 300 | # Current pod / instance status |
| 301 | [kubectl get pods / aws ecs describe-tasks / etc.] |
| 302 | |
| 303 | # Restart the service |
| 304 | [restart command] |
| 305 | |
| 306 | # Roll back to previous version |
| 307 | [rollback command] |
| 308 | |
| 309 | # Database connection count |
| 310 | [DB query] |
| 311 | |
| 312 | # Cache hit rate |
| 313 | [cache stats command] |
| 314 | |
| 315 | # Current request rate |
| 316 | [metrics query] |
| 317 | |
| 318 | |
| 319 | |
| 320 | |
| 321 | ## Useful Dashboard Links |
| 322 | |
| 323 | | Dashboard | URL | Use it to | |
| 324 | |---|---|---| |
| 325 | | Service overview | [Link] | First stop — error rate, latency, request rate | |
| 326 | | Database | [Link] | Connection count, slow queries, replication lag | |
| 327 | | Infrastructure | [Link] | CPU, memory, disk | |
| 328 | | Queue / consumers | [Link] | Backlog depth, consumer throughput | |
| 329 | | Upstream dependencies | [Link] | Dependency health at a glance | |
| 330 | |
| 331 | |
| 332 | |
| 333 | ## Incident Communication |
| 334 | |
| 335 | When you declare an incident: |
| 336 | |
| 337 | **Post to `#incidents` immediately:** |
| 338 | |
| 339 | 🔴 INCIDENT — [Service Name] |
| 340 | Status: Investigating |
| 341 | Impact: [Who is affected and how] |
| 342 | Paged: [Your name] |
| 343 | Next update: [Time — max 30 min from now] |
| 344 | |
| 345 | |
| 346 | **Update every 30 minutes while active:** |
| 347 | |
| 348 | 🔴 UPDATE — [Service Name] — [Time] |
| 349 | Status: [Investigating / Identified / Mitigating / Resolved] |
| 350 | Latest: [One sentence on what you found or did] |
| 351 | Next update: [Time] |
| 352 | |
| 353 | |
| 354 | **On resolution:** |
| 355 | |
| 356 | ✅ RESOLVED — [Service Name] — [Time] |
| 357 | Duration: [X minutes] |
| 358 | Impact: [Summary of who was affected] |
| 359 | Cause: [One sentence] |
| 360 | Follow-up: [PIR required? Yes/No — link when created] |
| 361 | |
| 362 | |
| 363 | |
| 364 | |
| 365 | ## On-Call Handoff |
| 366 | |
| 367 | Use this template at the end of every on-call shift: |
| 368 | |
| 369 | |
| 370 | --- ON-CALL HANDOFF: [Service Name] --- |
| 371 | Date: [Date] |
| 372 | Outgoing: [Your name] |
| 373 | Incoming: [Next on-call name] |
| 374 | |
| 375 | INCIDENTS THIS SHIFT: |
| 376 | - [Incident summary — date, duration, cause, resolution, follow-up required] |
| 377 | |
| 378 | OPEN ISSUES TO WATCH: |
| 379 | - [Anything not fully resolved / trending in the wrong direction] |
| 380 | |
| 381 | CHANGES SINCE LAST HANDOFF: |
| 382 | - [Deploys, config changes, infra changes that affect on-call awareness] |
| 383 | |
| 384 | RUNBOOK GAPS FOUND: |
| 385 | - [Anything you had to figure out that isn't documented — please add it] |
| 386 | |
| 387 | ANYTHING ELSE: |
| 388 | - [Notes for incoming on-call] |
| 389 | |
| 390 | |
| 391 | |
| 392 | |
| 393 | ## Quality Checks |
| 394 | |
| 395 | [ ] Every alert that pages on-call has a runbook entry — no alert is missing |
| 396 | [ ] Rollback command is accurate and tested recently |
| 397 | [ ] Escalation contacts have current phone numbers and Slack handles |
| 398 | [ ] Diagnostic commands work — they have been run by at least one person recently |
| 399 | [ ] Handoff template is used at every shift change — not just during incidents |
| 400 | [ ] "Things I had to figure out that weren't documented" are added to this runbook after every incident |
| 401 | |
| 402 | ## Anti-Patterns |
| 403 | |
| 404 | [ ] Do not write alert runbooks with vague diagnostic steps like "check the logs" — every step must specify the exact command, dashboard link, or query to run |
| 405 | [ ] Do not include an alert in the runbook that has no specific on-call action — an alert that pages someone with no defined response path creates panic, not resolution |
| 406 | [ ] Do not leave the rollback command undocumented or untested — a rollback procedure that has never been run will fail when needed most |
| 407 | [ ] Do not list escalation contacts without phone numbers and Slack handles — email-only escalation paths are useless during a 3am incident |
| 408 | [ ] Do not write the runbook once and treat it as permanent — runbooks go stale after incidents; every incident must trigger a review of the relevant runbook entries |
| 409 |
Discussion
Browse more free Claude skills or everything in Operations.