Monitoring Setup Guide Skill
Write a monitoring setup guide for a service — defining what to measure, how to alert on it, and how to build the observability stack covering the four golden signals, business metrics, log strategy, distributed tracing, alerting rules, dashboard layout, and observability debt.
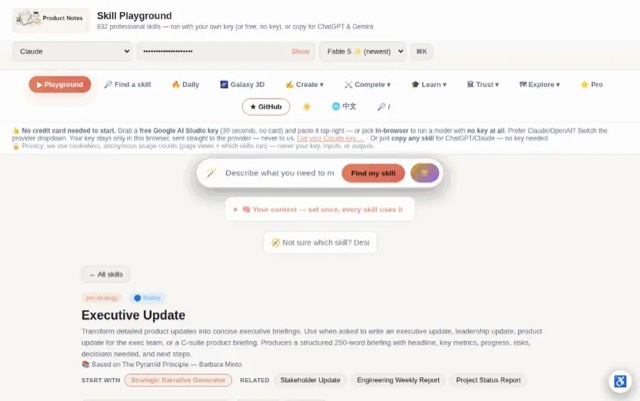

From the mohitagw15856/pm-claude-skills README — shows the whole collection, not only this skill. · view on GitHub
How to use it
Claude Code
- Run the line below. It pulls the whole folder into
~/.claude/skills/monitoring-setup-guide. - Describe your job in plain words. Claude Code follows the skill from there.
npx degit mohitagw15856/pm-claude-skills/skills/monitoring-setup-guide#main ~/.claude/skills/monitoring-setup-guideFor one project only, change the path to .claude/skills/monitoring-setup-guide.
Claude (web or desktop app)
- On this page open ⋯ → Download .md.
- Save it as SKILL.md in a folder, zip the folder, then Customize → Skills → + → Create skill → Upload a skill.
- Pick the file and Save. Claude shows the name and description and runs a security scan.
- Check the skill is switched on.
- Start a new chat and describe your job in plain words. The AI follows the skill from there.
ChatGPT or another app
- ChatGPT: make a Project and paste it into Instructions.
- Neither? Paste it at the top of a new chat — it works for that chat.
Not working?
- Check which app you pasted it into — the steps above name the right one.
- Some skills need the paid tier of Claude or ChatGPT.
Paste into Claude, ChatGPT or Cursor.
Source of Monitoring Setup Guide Skill
Show the full text445 lines
| name | description |
|---|---|
| monitoring-setup-guide | Write a monitoring setup guide for a service — defining what to measure, how to alert on it, and how to build the observability stack covering the four golden signals, business metrics, log strategy, distributed tracing, alerting rules, dashboard layout, and observability debt. Use when asked to set up monitoring for a service, define alerting strategy, write an observability plan, create a dashboard specification, or document logging standards for a team. Produces a metric definitions table, alert rules specification, dashboard layout wireframe, log schema, tracing setup checklist, and monitoring gap analysis. |
Monitoring Setup Guide Skill
Produce a complete monitoring setup guide for a service — defining exactly what to measure, how to structure logs, how to configure alerts with actionable thresholds, and how to build dashboards that answer real operational questions. A good monitoring guide eliminates "we don't know what's happening in production" as a root cause category, and gives on-call engineers a single source of truth for what healthy looks like.
Required Inputs
Ask for these if not already provided:
- Service name and description — what the service does and its role in the system
- Tech stack — language, framework, and infrastructure (e.g. Go/gRPC on Kubernetes, Python/FastAPI on ECS)
- Current monitoring tooling — Datadog, Prometheus + Grafana, CloudWatch, New Relic, Honeycomb, or none yet
- Key user journeys — the 2–4 most important things a user or consumer does with the service (these drive what to alert on)
- Existing alerts — paste any existing alert configurations or describe what's currently monitored
Output Format
Monitoring Setup Guide: [Service Name]
Team: [Team name] | Tech lead: [Name] Stack: [Language/Framework] on [Infrastructure] Monitoring platform: [Datadog / Prometheus+Grafana / CloudWatch / etc.] Date: [Date] | Review cycle: Quarterly
1. Monitoring Philosophy
Good monitoring answers three questions:
- Is the service healthy right now? (alerting)
- Was it healthy in the past, and is it trending worse? (dashboards + SLO tracking)
- Why did something fail? (logs + traces)
This guide defines the answers for [Service Name]. Every alert must be actionable — if an on-call engineer cannot take a specific action in response to the alert, the alert should not exist.
Key user journeys monitored:
- Journey 1: [e.g. "User submits a payment — POST /charges, receives confirmation"]
- Journey 2: [e.g. "User views transaction history — GET /transactions"]
- Journey 3: [e.g. "Subscription renewal job runs — background worker processes billing events"]
2. The Four Golden Signals
Apply the four golden signals specifically to [Service Name]:
Latency
Latency measures how long requests take to complete. Track it separately for successful and failed requests — slow failures hide behind fast errors if you only measure aggregate latency.
| Metric | Description | Source | Dimensions |
|---|---|---|---|
[service].request.duration_ms |
End-to-end request latency | Application instrumentation | endpoint, method, status_code |
[service].db.query_duration_ms |
Database query latency | ORM / query instrumentation | query_name, table |
[service].external.request_duration_ms |
Outbound call latency to dependencies | HTTP client instrumentation | target_service, endpoint |
[service].queue.processing_duration_ms |
Time to process one message (if applicable) | Consumer instrumentation | queue_name, message_type |
Latency SLO targets:
| Endpoint / operation | p50 target | p95 target | p99 target |
|---|---|---|---|
GET /api/v1/[resource] |
< [50] ms | < [200] ms | < [500] ms |
POST /api/v1/[resource] |
< [100] ms | < [400] ms | < [1000] ms |
GET /health |
< [10] ms | < [20] ms | < [50] ms |
| [Background job name] | < [5] sec | < [15] sec | < [60] sec |
Traffic
Traffic measures demand on the system. Use it to detect unexpected spikes, traffic drops (which can indicate upstream failures), and to capacity-plan.
| Metric | Description | Source |
|---|---|---|
[service].request.count |
Requests per second | Application / load balancer |
[service].request.count_by_endpoint |
RPS broken down by endpoint | Application |
[service].queue.messages_consumed_per_second |
Consumer throughput | Queue consumer |
[service].queue.depth |
Messages waiting in queue | Queue metrics |
Traffic baselines (update after observing production for 2+ weeks):
| Time period | Expected RPS | Low-traffic floor | Spike ceiling |
|---|---|---|---|
| Peak (weekday business hours) | [N] RPS | [N × 0.5] RPS | [N × 5] RPS |
| Off-peak (nights/weekends) | [N × 0.2] RPS | [N × 0.05] RPS | [N] RPS |
Errors
Errors measure the fraction of requests that fail. Distinguish between client errors (4xx — caller is doing something wrong) and server errors (5xx — the service is broken).
| Metric | Description | Alert on? |
|---|---|---|
[service].request.error_rate |
5xx errors / total requests | Yes — see alert rules |
[service].request.client_error_rate |
4xx errors / total requests | Threshold alert — sudden spike may indicate API misuse |
[service].dependency.error_rate |
Errors calling downstream dependencies | Yes — upstream health signal |
[service].queue.dlq_depth |
Messages in dead-letter queue | Yes — indicates processing failures |
Saturation
Saturation measures how "full" the service is — how close to maximum capacity are the constrained resources.
| Resource | Metric | Alert threshold | Source |
|---|---|---|---|
| CPU | [service].cpu.utilisation_pct |
>80% sustained 5 min | Container / VM metrics |
| Memory | [service].memory.utilisation_pct |
>85% sustained 5 min | Container / VM metrics |
| DB connections | [service].db.connection_pool.utilisation_pct |
>75% | Application / DB metrics |
| Thread pool / goroutines | [service].runtime.goroutine_count / thread_count |
>N (establish baseline) | Runtime metrics |
| Disk (if applicable) | [service].disk.utilisation_pct |
>75% | Infrastructure |
| Queue depth (if applicable) | [service].queue.depth |
>[backlog threshold] | Queue metrics |
3. Business Metrics
Beyond the golden signals, track metrics that measure whether the service is delivering business value. These matter for SLO reporting and product dashboards.
| Metric | Description | Source | Alert? |
|---|---|---|---|
[service].[primary_action].success_rate |
[e.g. "Payment success rate"] | Application | Yes — if drops >5% vs 1h average |
[service].[primary_action].count |
[e.g. "Payments processed per minute"] | Application | Yes — sudden drop (traffic anomaly) |
[service].[resource].created_per_hour |
[e.g. "New accounts created"] | Application / DB | No — informational |
[service].cache.hit_rate |
Fraction of requests served from cache | Cache instrumentation | Yes — if drops below [60]% |
[service].job.[name].success_rate |
[Background job success rate] | Job framework | Yes — if drops below [99]% |
4. Log Strategy
Structured Logging Schema
All logs must be structured JSON. Do not emit unstructured text logs in production. Every log line must include the mandatory fields.
Mandatory fields (every log line):
{
  "timestamp": "2024-01-15T10:23:45.123Z",
  "level": "info",
  "service": "[service-name]",
  "version": "[git-sha-short]",
  "trace_id": "[uuid-from-request-context]",
  "span_id": "[span-uuid]",
  "request_id": "[uuid-per-request]",
  "message": "[human readable description]"
}
Request log (emit for every HTTP request):
{
  "timestamp": "...",
  "level": "info",
  "service": "[service-name]",
  "event": "http_request",
  "method": "POST",
  "path": "/api/v1/[resource]",
  "status_code": 201,
  "duration_ms": 45,
  "user_id": "[uuid — DO NOT log PII directly]",
  "request_id": "[uuid]",
  "trace_id": "[uuid]"
}
Error log (emit for every error with context):
{
  "timestamp": "...",
  "level": "error",
  "service": "[service-name]",
  "event": "error",
  "error_code": "[application-error-code]",
  "error_message": "[description — no sensitive data]",
  "stack_trace": "[stack trace]",
  "request_id": "[uuid]",
  "trace_id": "[uuid]",
  "context": {
    "[key]": "[relevant context without PII]"
  }
}
Log Levels — When to Use Each
| Level | Use when | Example |
|---|---|---|
error |
Something failed that requires attention — this should page on-call eventually | Database query failed, external API returned 5xx, required config missing |
warn |
Something unexpected happened but service is still functioning | Retry succeeded after failure, cache miss on expected hit, rate limit approaching |
info |
Significant business events and request lifecycle | Request received, payment processed, user authenticated, job started/completed |
debug |
Detailed diagnostic information — off in production by default | Query parameters, intermediate computation results, cache key lookups |
What NOT to Log
Never log:
- Passwords, tokens, API keys, or secrets (even hashed)
- Full credit card numbers or PAN data
- Social security numbers or government IDs
- Full names + dates of birth + contact info in the same log line (PII aggregation)
- Request/response bodies in full (use field-level extraction instead)
- Health check requests (too noisy — exclude
GET /healthfrom access logs)
5. Distributed Tracing Setup
Distributed tracing is mandatory for any service that calls other services. It enables root-cause analysis across service boundaries.
Instrumentation Checklist
[ ] Tracing library installed:
    - Go: go.opentelemetry.io/otel
    - Python: opentelemetry-sdk, opentelemetry-instrumentation
    - Node: @opentelemetry/sdk-node
    - Java: opentelemetry-java-instrumentation

[ ] Tracer initialized at service startup with service name and version

[ ] Trace context propagated via W3C Trace Context headers:
    traceparent: 00-[trace-id]-[span-id]-01
    tracestate: [optional vendor-specific]

[ ] Automatic instrumentation enabled for:
    [ ] Inbound HTTP/gRPC requests (creates root span)
    [ ] Outbound HTTP/gRPC calls (creates child spans)
    [ ] Database queries (creates child spans with sanitized query)
    [ ] Cache operations (Redis, Memcached)
    [ ] Message queue produce/consume

[ ] Custom spans added for:
    [ ] Key business operations ([e.g. payment processing, user lookup])
    [ ] Background jobs (each job execution = root span)
    [ ] Third-party API calls with custom attributes

[ ] Span attributes to capture on all spans:
    - user.id (if authenticated — no PII)
    - deployment.environment (production/staging)
    - service.version (git SHA)
    - [service-specific key attributes]

[ ] Trace exporter configured to: [Datadog / Jaeger / Tempo / OTLP endpoint]

[ ] Sampling rate configured:
    - Production: [1–10]% of requests (adjust based on volume and cost)
    - Always sample: errors, slow requests (>p99 threshold), and 100% of [critical endpoint]
Trace Instrumentation Examples
# Python — OpenTelemetry example
from opentelemetry import trace

tracer = trace.get_tracer("[service-name]")

def process_payment(payment_data):
    with tracer.start_as_current_span("process_payment") as span:
        span.set_attribute("payment.amount_cents", payment_data["amount"])
        span.set_attribute("payment.currency", payment_data["currency"])
        # Never: span.set_attribute("payment.card_number", ...)
        try:
            result = _do_process(payment_data)
            span.set_status(trace.StatusCode.OK)
            return result
        except PaymentError as e:
            span.set_status(trace.StatusCode.ERROR, str(e))
            span.record_exception(e)
            raise
6. Alert Rules Specification
Every alert must have: a name, a condition, a threshold, a severity, and a clear on-call action. Alerts without a clear action should not exist.
Alert Definitions
| Alert name | Condition | Threshold | Severity | On-call action |
|---|---|---|---|---|
[Service]HighErrorRate |
5xx error rate, 5-min rolling window | >1% for 2 consecutive windows | P1 | Check recent deploys; inspect error logs; see runbook [link] |
[Service]CriticalErrorRate |
5xx error rate, 2-min rolling window | >5% | P1 — immediate | Same as above — page immediately, do not wait |
[Service]HighP99Latency |
p99 latency on key endpoints | >2× SLO target for 3 min | P2 | Check DB latency, cache hit rate, and upstream dependencies |
[Service]LatencySLOBreach |
p99 latency | >SLO target for 5 consecutive minutes | P1 | SLO burn — page on-call, escalate if not resolved in 20 min |
[Service]HighCPU |
CPU utilisation | >80% sustained for 5 min | P2 | Check for traffic spike; scale up if needed; check for runaway processes |
[Service]HighMemory |
Memory utilisation | >85% sustained for 5 min | P2 | Check for memory leak (especially after deploys); restart pod if OOM imminent |
[Service]DBConnectionPoolHigh |
DB connection pool utilisation | >75% | P2 | Check for long-running queries; consider scaling service or increasing pool size |
[Service]DLQDepthHigh |
Dead-letter queue depth | >10 messages | P2 | Inspect DLQ messages for error pattern; fix bug and replay if safe |
[Service]TrafficDropAnomaly |
RPS, compared to same hour yesterday | >50% drop sustained 5 min | P1 | Upstream may be down; check caller health; check load balancer |
[Service]PrimaryActionSuccessRateDrop |
[Business metric success rate] | <[95]% over 10 min | P1 | [Service-specific action — e.g. "Check payment provider status"] |
[Service]DownstreamDependencyErrors |
Error rate calling [dependency] | >5% over 5 min | P2 | Check [dependency] status page; enable fallback if available |
Alert Configuration Examples
# Prometheus / Grafana alerting rules (adapt for your platform)
groups:
  - name: [service-name]-alerts
    rules:

      - alert: [Service]HighErrorRate
        expr: |
          (
            sum(rate([service]_http_requests_total{status=~"5.."}[5m]))
            /
            sum(rate([service]_http_requests_total[5m]))
          ) > 0.01
        for: 2m
        labels:
          severity: critical
          team: [team-name]
        annotations:
          summary: "High error rate on [Service Name]"
          description: "Error rate is {{ $value | humanizePercentage }} (threshold: 1%)"
          runbook_url: "[runbook link]"

      - alert: [Service]HighP99Latency
        expr: |
          histogram_quantile(0.99,
            sum(rate([service]_http_request_duration_seconds_bucket[5m])) by (le, endpoint)
          ) > [0.5]
        for: 3m
        labels:
          severity: warning
          team: [team-name]
        annotations:
          summary: "p99 latency elevated on [Service Name]"
          description: "p99 latency on {{ $labels.endpoint }} is {{ $value | humanizeDuration }}"
          runbook_url: "[runbook link]"
# Datadog monitor configuration (Python SDK or Terraform)
import datadog

datadog.initialize(api_key="[key]", app_key="[key]")

datadog.api.Monitor.create(
    type="metric alert",
    query=f"sum(last_5m):sum:{{service}}.http.errors{{service:[service-name]}} / sum:{{service}}.http.requests{{service:[service-name]}} > 0.01",
    name="[Service] High Error Rate",
    message="Error rate exceeded 1%. @pagerduty-[service-oncall]\n\nRunbook: [link]",
    tags=["service:[service-name]", "team:[team-name]"],
    options={
        "thresholds": {"critical": 0.01, "warning": 0.005},
        "notify_no_data": False,
        "evaluation_delay": 60,
    }
)
7. Dashboard Layout Specification
The primary service dashboard must answer "is the service healthy right now?" at a glance. Use this layout:
┌─────────────────────────────────────────────────────────────────────┐
│  [SERVICE NAME] — Service Health Dashboard           [Time range ▼] │
├───────────────┬───────────────┬───────────────┬─────────────────────┤
│  Error rate   │  p99 Latency  │  RPS (current)│  SLO budget remaining│
│  [BIG NUMBER] │  [BIG NUMBER] │  [BIG NUMBER] │  [BIG NUMBER / days] │
│  vs SLO: 0.1% │  vs SLO: 500ms│  vs avg: [N]  │  [Error budget gauge]│
├───────────────┴───────────────┴───────────────┴─────────────────────┤
│                   Error rate over time (24h)                        │
│  [Time series: 5xx rate line, SLO threshold line]                   │
├─────────────────────────────────┬───────────────────────────────────┤
│  Latency percentiles over time  │  Request throughput over time     │
│  [Lines: p50, p95, p99, p999]   │  [Bars: RPS by endpoint]          │
│  [SLO threshold horizontal line]│                                   │
├─────────────────────────────────┴───────────────────────────────────┤
│  Latency heatmap (all requests — shows distribution shape)          │
├─────────────────────────────────┬───────────────────────────────────┤
│  CPU utilisation over time      │  Memory utilisation over time     │
│  [All instances/pods — lines]   │  [All instances/pods — lines]     │
│  [Alert threshold: 80%]         │  [Alert threshold: 85%]           │
├─────────────────────────────────┴───────────────────────────────────┤
│  DB: connection pool utilisation│  DB: query latency (p99 per query)│
├─────────────────────────────────┴───────────────────────────────────┤
│  [Business metric 1 over time]  │  [Business metric 2 over time]    │
│  e.g. Payment success rate      │  e.g. Orders created/min          │
└─────────────────────────────────┴───────────────────────────────────┘
Second dashboard — Dependency Health:
┌─────────────────────────────────────────────────────────────────────┐
│  [SERVICE NAME] — Dependency Health                                 │
├─────────────────────────────────────────────────────────────────────┤
│  For each dependency: error rate | latency | current status         │
│  [Database]    [N]% errors | [N]ms p99 | ● Healthy / ⚠ Degraded    │
│  [Redis]       [N]% errors | [N]ms p99 | ● Healthy                 │
│  [External API][N]% errors | [N]ms p99 | ● Healthy                 │
├─────────────────────────────────────────────────────────────────────┤
│  Outbound call latency over time (one line per dependency)          │
├─────────────────────────────────────────────────────────────────────┤
│  Circuit breaker / fallback state (if implemented)                  │
└─────────────────────────────────────────────────────────────────────┘
8. Observability Debt Analysis
Honest assessment of what is missing today and what the priority to add it is:
| Gap | Impact | Priority | Effort | Owner | Target date |
|---|---|---|---|---|---|
| [e.g. No distributed tracing — can't see cross-service latency] | High — blind to dependency issues | P1 | [2 days] | [Name] | [Date] |
| [e.g. No business metric alerts — only infra alerts] | High — silent business failures | P1 | [1 day] | [Name] | [Date] |
| [e.g. Logs are unstructured text — not searchable] | Medium — slow incident investigation | P2 | [3 days] | [Name] | [Date] |
| [e.g. No dead-letter queue monitoring] | Medium — failed messages go unnoticed | P2 | [4 hours] | [Name] | [Date] |
| [e.g. Alert thresholds not calibrated to production baseline] | Medium — alert fatigue or missed alerts | P2 | [1 day] | [Name] | [Date] |
| [e.g. No latency heatmap — outliers invisible in averages] | Low — harder to spot tail latency issues | P3 | [2 hours] | [Name] | [Date] |
Total observability debt: [N] items | Estimated effort: [N days]
Quality Checks
- Every alert has a named on-call action — no alert says "investigate" without specifying what to investigate first
- Alert thresholds are calibrated against production baselines, not set to default values from a template
- Structured logging is implemented — no unstructured text log lines in production
- PII is explicitly excluded from logs — a named engineer has verified this
- Distributed tracing is propagating trace IDs across all service boundaries (verify with a test request)
- The primary dashboard answers "is the service healthy?" in under 10 seconds — no hunting for the right panel
- Business metrics are tracked alongside infrastructure metrics — not just four golden signals
- Observability debt items have owners and dates — not just "would be nice to have"
Anti-Patterns
- Do not create alerts without a specific on-call action — an alert that just says "investigate" trains engineers to ignore it
- Do not set alert thresholds from a template without calibrating against production baselines — uncalibrated thresholds cause either alert fatigue or missed incidents
- Do not log PII, tokens, or secrets — a logging standard is incomplete without an explicit list of what must never be logged
- Do not measure only the four golden signals without adding at least one business metric alert — infrastructure health can be green while the business-critical path is silently failing
- Do not deploy distributed tracing without verifying that trace IDs propagate across all service boundaries — partial tracing is worse than no tracing because it produces misleading incomplete traces
| 1 | |
| 2 | name monitoring-setup-guide |
| 3 | description "Write a monitoring setup guide for a service — defining what to measure, how to alert on it, and how to build the observability stack covering the four golden signals, business metrics, log strategy, distributed tracing, alerting rules, dashboard layout, and observability debt. Use when asked to set up monitoring for a service, define alerting strategy, write an observability plan, create a dashboard specification, or document logging standards for a team. Produces a metric definitions table, alert rules specification, dashboard layout wireframe, log schema, tracing setup checklist, and monitoring gap analysis." |
| 4 | |
| 5 | |
| 6 | # Monitoring Setup Guide Skill |
| 7 | |
| 8 | Produce a complete monitoring setup guide for a service — defining exactly what to measure, how to structure logs, how to configure alerts with actionable thresholds, and how to build dashboards that answer real operational questions. A good monitoring guide eliminates "we don't know what's happening in production" as a root cause category, and gives on-call engineers a single source of truth for what healthy looks like. |
| 9 | |
| 10 | ## Required Inputs |
| 11 | |
| 12 | Ask for these if not already provided: |
| 13 | **Service name and description** — what the service does and its role in the system |
| 14 | **Tech stack** — language, framework, and infrastructure (e.g. Go/gRPC on Kubernetes, Python/FastAPI on ECS) |
| 15 | **Current monitoring tooling** — Datadog, Prometheus + Grafana, CloudWatch, New Relic, Honeycomb, or none yet |
| 16 | **Key user journeys** — the 2–4 most important things a user or consumer does with the service (these drive what to alert on) |
| 17 | **Existing alerts** — paste any existing alert configurations or describe what's currently monitored |
| 18 | |
| 19 | ## Output Format |
| 20 | |
| 21 | |
| 22 | |
| 23 | # Monitoring Setup Guide: [Service Name] |
| 24 | |
| 25 | **Team:** [Team name] | **Tech lead:** [Name] |
| 26 | **Stack:** [Language/Framework] on [Infrastructure] |
| 27 | **Monitoring platform:** [Datadog / Prometheus+Grafana / CloudWatch / etc.] |
| 28 | **Date:** [Date] | **Review cycle:** Quarterly |
| 29 | |
| 30 | |
| 31 | |
| 32 | ## 1. Monitoring Philosophy |
| 33 | |
| 34 | Good monitoring answers three questions: |
| 35 | **Is the service healthy right now?** (alerting) |
| 36 | **Was it healthy in the past, and is it trending worse?** (dashboards + SLO tracking) |
| 37 | **Why did something fail?** (logs + traces) |
| 38 | |
| 39 | This guide defines the answers for [Service Name]. Every alert must be actionable — if an on-call engineer cannot take a specific action in response to the alert, the alert should not exist. |
| 40 | |
| 41 | **Key user journeys monitored:** |
| 42 | Journey 1: [e.g. "User submits a payment — POST /charges, receives confirmation"] |
| 43 | Journey 2: [e.g. "User views transaction history — GET /transactions"] |
| 44 | Journey 3: [e.g. "Subscription renewal job runs — background worker processes billing events"] |
| 45 | |
| 46 | |
| 47 | |
| 48 | ## 2. The Four Golden Signals |
| 49 | |
| 50 | Apply the four golden signals specifically to [Service Name]: |
| 51 | |
| 52 | ### Latency |
| 53 | |
| 54 | Latency measures how long requests take to complete. Track it separately for successful and failed requests — slow failures hide behind fast errors if you only measure aggregate latency. |
| 55 | |
| 56 | | Metric | Description | Source | Dimensions | |
| 57 | |---|---|---|---| |
| 58 | | `[service].request.duration_ms` | End-to-end request latency | Application instrumentation | `endpoint`, `method`, `status_code` | |
| 59 | | `[service].db.query_duration_ms` | Database query latency | ORM / query instrumentation | `query_name`, `table` | |
| 60 | | `[service].external.request_duration_ms` | Outbound call latency to dependencies | HTTP client instrumentation | `target_service`, `endpoint` | |
| 61 | | `[service].queue.processing_duration_ms` | Time to process one message (if applicable) | Consumer instrumentation | `queue_name`, `message_type` | |
| 62 | |
| 63 | **Latency SLO targets:** |
| 64 | |
| 65 | | Endpoint / operation | p50 target | p95 target | p99 target | |
| 66 | |---|---|---|---| |
| 67 | | `GET /api/v1/[resource]` | < [50] ms | < [200] ms | < [500] ms | |
| 68 | | `POST /api/v1/[resource]` | < [100] ms | < [400] ms | < [1000] ms | |
| 69 | | `GET /health` | < [10] ms | < [20] ms | < [50] ms | |
| 70 | | [Background job name] | < [5] sec | < [15] sec | < [60] sec | |
| 71 | |
| 72 | ### Traffic |
| 73 | |
| 74 | Traffic measures demand on the system. Use it to detect unexpected spikes, traffic drops (which can indicate upstream failures), and to capacity-plan. |
| 75 | |
| 76 | | Metric | Description | Source | |
| 77 | |---|---|---| |
| 78 | | `[service].request.count` | Requests per second | Application / load balancer | |
| 79 | | `[service].request.count_by_endpoint` | RPS broken down by endpoint | Application | |
| 80 | | `[service].queue.messages_consumed_per_second` | Consumer throughput | Queue consumer | |
| 81 | | `[service].queue.depth` | Messages waiting in queue | Queue metrics | |
| 82 | |
| 83 | **Traffic baselines (update after observing production for 2+ weeks):** |
| 84 | |
| 85 | | Time period | Expected RPS | Low-traffic floor | Spike ceiling | |
| 86 | |---|---|---|---| |
| 87 | | Peak (weekday business hours) | [N] RPS | [N × 0.5] RPS | [N × 5] RPS | |
| 88 | | Off-peak (nights/weekends) | [N × 0.2] RPS | [N × 0.05] RPS | [N] RPS | |
| 89 | |
| 90 | ### Errors |
| 91 | |
| 92 | Errors measure the fraction of requests that fail. Distinguish between client errors (4xx — caller is doing something wrong) and server errors (5xx — the service is broken). |
| 93 | |
| 94 | | Metric | Description | Alert on? | |
| 95 | |---|---|---| |
| 96 | | `[service].request.error_rate` | 5xx errors / total requests | Yes — see alert rules | |
| 97 | | `[service].request.client_error_rate` | 4xx errors / total requests | Threshold alert — sudden spike may indicate API misuse | |
| 98 | | `[service].dependency.error_rate` | Errors calling downstream dependencies | Yes — upstream health signal | |
| 99 | | `[service].queue.dlq_depth` | Messages in dead-letter queue | Yes — indicates processing failures | |
| 100 | |
| 101 | ### Saturation |
| 102 | |
| 103 | Saturation measures how "full" the service is — how close to maximum capacity are the constrained resources. |
| 104 | |
| 105 | | Resource | Metric | Alert threshold | Source | |
| 106 | |---|---|---|---| |
| 107 | | CPU | `[service].cpu.utilisation_pct` | >80% sustained 5 min | Container / VM metrics | |
| 108 | | Memory | `[service].memory.utilisation_pct` | >85% sustained 5 min | Container / VM metrics | |
| 109 | | DB connections | `[service].db.connection_pool.utilisation_pct` | >75% | Application / DB metrics | |
| 110 | | Thread pool / goroutines | `[service].runtime.goroutine_count` / `thread_count` | >N (establish baseline) | Runtime metrics | |
| 111 | | Disk (if applicable) | `[service].disk.utilisation_pct` | >75% | Infrastructure | |
| 112 | | Queue depth (if applicable) | `[service].queue.depth` | >[backlog threshold] | Queue metrics | |
| 113 | |
| 114 | |
| 115 | |
| 116 | ## 3. Business Metrics |
| 117 | |
| 118 | Beyond the golden signals, track metrics that measure whether the service is delivering business value. These matter for SLO reporting and product dashboards. |
| 119 | |
| 120 | | Metric | Description | Source | Alert? | |
| 121 | |---|---|---|---| |
| 122 | | `[service].[primary_action].success_rate` | [e.g. "Payment success rate"] | Application | Yes — if drops >5% vs 1h average | |
| 123 | | `[service].[primary_action].count` | [e.g. "Payments processed per minute"] | Application | Yes — sudden drop (traffic anomaly) | |
| 124 | | `[service].[resource].created_per_hour` | [e.g. "New accounts created"] | Application / DB | No — informational | |
| 125 | | `[service].cache.hit_rate` | Fraction of requests served from cache | Cache instrumentation | Yes — if drops below [60]% | |
| 126 | | `[service].job.[name].success_rate` | [Background job success rate] | Job framework | Yes — if drops below [99]% | |
| 127 | |
| 128 | |
| 129 | |
| 130 | ## 4. Log Strategy |
| 131 | |
| 132 | ### Structured Logging Schema |
| 133 | |
| 134 | All logs must be structured JSON. Do not emit unstructured text logs in production. Every log line must include the mandatory fields. |
| 135 | |
| 136 | **Mandatory fields (every log line):** |
| 137 | |
| 138 | |
| 139 | { |
| 140 | "timestamp": "2024-01-15T10:23:45.123Z", |
| 141 | "level": "info", |
| 142 | "service": "[service-name]", |
| 143 | "version": "[git-sha-short]", |
| 144 | "trace_id": "[uuid-from-request-context]", |
| 145 | "span_id": "[span-uuid]", |
| 146 | "request_id": "[uuid-per-request]", |
| 147 | "message": "[human readable description]" |
| 148 | } |
| 149 | |
| 150 | |
| 151 | **Request log (emit for every HTTP request):** |
| 152 | |
| 153 | |
| 154 | { |
| 155 | "timestamp": "...", |
| 156 | "level": "info", |
| 157 | "service": "[service-name]", |
| 158 | "event": "http_request", |
| 159 | "method": "POST", |
| 160 | "path": "/api/v1/[resource]", |
| 161 | "status_code": 201, |
| 162 | "duration_ms": 45, |
| 163 | "user_id": "[uuid — DO NOT log PII directly]", |
| 164 | "request_id": "[uuid]", |
| 165 | "trace_id": "[uuid]" |
| 166 | } |
| 167 | |
| 168 | |
| 169 | **Error log (emit for every error with context):** |
| 170 | |
| 171 | |
| 172 | { |
| 173 | "timestamp": "...", |
| 174 | "level": "error", |
| 175 | "service": "[service-name]", |
| 176 | "event": "error", |
| 177 | "error_code": "[application-error-code]", |
| 178 | "error_message": "[description — no sensitive data]", |
| 179 | "stack_trace": "[stack trace]", |
| 180 | "request_id": "[uuid]", |
| 181 | "trace_id": "[uuid]", |
| 182 | "context": { |
| 183 | "[key]": "[relevant context without PII]" |
| 184 | } |
| 185 | } |
| 186 | |
| 187 | |
| 188 | ### Log Levels — When to Use Each |
| 189 | |
| 190 | | Level | Use when | Example | |
| 191 | |---|---|---| |
| 192 | | `error` | Something failed that requires attention — this should page on-call eventually | Database query failed, external API returned 5xx, required config missing | |
| 193 | | `warn` | Something unexpected happened but service is still functioning | Retry succeeded after failure, cache miss on expected hit, rate limit approaching | |
| 194 | | `info` | Significant business events and request lifecycle | Request received, payment processed, user authenticated, job started/completed | |
| 195 | | `debug` | Detailed diagnostic information — off in production by default | Query parameters, intermediate computation results, cache key lookups | |
| 196 | |
| 197 | ### What NOT to Log |
| 198 | |
| 199 | **Never log:** |
| 200 | Passwords, tokens, API keys, or secrets (even hashed) |
| 201 | Full credit card numbers or PAN data |
| 202 | Social security numbers or government IDs |
| 203 | Full names + dates of birth + contact info in the same log line (PII aggregation) |
| 204 | Request/response bodies in full (use field-level extraction instead) |
| 205 | Health check requests (too noisy — exclude `GET /health` from access logs) |
| 206 | |
| 207 | |
| 208 | |
| 209 | ## 5. Distributed Tracing Setup |
| 210 | |
| 211 | Distributed tracing is mandatory for any service that calls other services. It enables root-cause analysis across service boundaries. |
| 212 | |
| 213 | ### Instrumentation Checklist |
| 214 | |
| 215 | |
| 216 | [ ] Tracing library installed: |
| 217 | - Go: go.opentelemetry.io/otel |
| 218 | - Python: opentelemetry-sdk, opentelemetry-instrumentation |
| 219 | - Node: @opentelemetry/sdk-node |
| 220 | - Java: opentelemetry-java-instrumentation |
| 221 | |
| 222 | [ ] Tracer initialized at service startup with service name and version |
| 223 | |
| 224 | [ ] Trace context propagated via W3C Trace Context headers: |
| 225 | traceparent: 00-[trace-id]-[span-id]-01 |
| 226 | tracestate: [optional vendor-specific] |
| 227 | |
| 228 | [ ] Automatic instrumentation enabled for: |
| 229 | [ ] Inbound HTTP/gRPC requests (creates root span) |
| 230 | [ ] Outbound HTTP/gRPC calls (creates child spans) |
| 231 | [ ] Database queries (creates child spans with sanitized query) |
| 232 | [ ] Cache operations (Redis, Memcached) |
| 233 | [ ] Message queue produce/consume |
| 234 | |
| 235 | [ ] Custom spans added for: |
| 236 | [ ] Key business operations ([e.g. payment processing, user lookup]) |
| 237 | [ ] Background jobs (each job execution = root span) |
| 238 | [ ] Third-party API calls with custom attributes |
| 239 | |
| 240 | [ ] Span attributes to capture on all spans: |
| 241 | - user.id (if authenticated — no PII) |
| 242 | - deployment.environment (production/staging) |
| 243 | - service.version (git SHA) |
| 244 | - [service-specific key attributes] |
| 245 | |
| 246 | [ ] Trace exporter configured to: [Datadog / Jaeger / Tempo / OTLP endpoint] |
| 247 | |
| 248 | [ ] Sampling rate configured: |
| 249 | - Production: [1–10]% of requests (adjust based on volume and cost) |
| 250 | - Always sample: errors, slow requests (>p99 threshold), and 100% of [critical endpoint] |
| 251 | |
| 252 | |
| 253 | ### Trace Instrumentation Examples |
| 254 | |
| 255 | |
| 256 | # Python — OpenTelemetry example |
| 257 | from opentelemetry import trace |
| 258 | |
| 259 | tracer = trace.get_tracer("[service-name]") |
| 260 | |
| 261 | def process_payment(payment_data): |
| 262 | with tracer.start_as_current_span("process_payment") as span: |
| 263 | span.set_attribute("payment.amount_cents", payment_data["amount"]) |
| 264 | span.set_attribute("payment.currency", payment_data["currency"]) |
| 265 | # Never: span.set_attribute("payment.card_number", ...) |
| 266 | try: |
| 267 | result = _do_process(payment_data) |
| 268 | span.set_status(trace.StatusCode.OK) |
| 269 | return result |
| 270 | except PaymentError as e: |
| 271 | span.set_status(trace.StatusCode.ERROR, str(e)) |
| 272 | span.record_exception(e) |
| 273 | raise |
| 274 | |
| 275 | |
| 276 | |
| 277 | |
| 278 | ## 6. Alert Rules Specification |
| 279 | |
| 280 | Every alert must have: a name, a condition, a threshold, a severity, and a clear on-call action. Alerts without a clear action should not exist. |
| 281 | |
| 282 | ### Alert Definitions |
| 283 | |
| 284 | | Alert name | Condition | Threshold | Severity | On-call action | |
| 285 | |---|---|---|---|---| |
| 286 | | `[Service]HighErrorRate` | 5xx error rate, 5-min rolling window | >1% for 2 consecutive windows | P1 | Check recent deploys; inspect error logs; see runbook [link] | |
| 287 | | `[Service]CriticalErrorRate` | 5xx error rate, 2-min rolling window | >5% | P1 — immediate | Same as above — page immediately, do not wait | |
| 288 | | `[Service]HighP99Latency` | p99 latency on key endpoints | >2× SLO target for 3 min | P2 | Check DB latency, cache hit rate, and upstream dependencies | |
| 289 | | `[Service]LatencySLOBreach` | p99 latency | >SLO target for 5 consecutive minutes | P1 | SLO burn — page on-call, escalate if not resolved in 20 min | |
| 290 | | `[Service]HighCPU` | CPU utilisation | >80% sustained for 5 min | P2 | Check for traffic spike; scale up if needed; check for runaway processes | |
| 291 | | `[Service]HighMemory` | Memory utilisation | >85% sustained for 5 min | P2 | Check for memory leak (especially after deploys); restart pod if OOM imminent | |
| 292 | | `[Service]DBConnectionPoolHigh` | DB connection pool utilisation | >75% | P2 | Check for long-running queries; consider scaling service or increasing pool size | |
| 293 | | `[Service]DLQDepthHigh` | Dead-letter queue depth | >10 messages | P2 | Inspect DLQ messages for error pattern; fix bug and replay if safe | |
| 294 | | `[Service]TrafficDropAnomaly` | RPS, compared to same hour yesterday | >50% drop sustained 5 min | P1 | Upstream may be down; check caller health; check load balancer | |
| 295 | | `[Service]PrimaryActionSuccessRateDrop` | [Business metric success rate] | <[95]% over 10 min | P1 | [Service-specific action — e.g. "Check payment provider status"] | |
| 296 | | `[Service]DownstreamDependencyErrors` | Error rate calling [dependency] | >5% over 5 min | P2 | Check [dependency] status page; enable fallback if available | |
| 297 | |
| 298 | ### Alert Configuration Examples |
| 299 | |
| 300 | |
| 301 | # Prometheus / Grafana alerting rules (adapt for your platform) |
| 302 | groups: |
| 303 | - name: [service-name]-alerts |
| 304 | rules: |
| 305 | |
| 306 | - alert: [Service]HighErrorRate |
| 307 | expr: | |
| 308 | ( |
| 309 | sum(rate([service]_http_requests_total{status=~"5.."}[5m])) |
| 310 | / |
| 311 | sum(rate([service]_http_requests_total[5m])) |
| 312 | ) > 0.01 |
| 313 | for: 2m |
| 314 | labels: |
| 315 | severity: critical |
| 316 | team: [team-name] |
| 317 | annotations: |
| 318 | summary: "High error rate on [Service Name]" |
| 319 | description: "Error rate is {{ $value | humanizePercentage }} (threshold: 1%)" |
| 320 | runbook_url: "[runbook link]" |
| 321 | |
| 322 | - alert: [Service]HighP99Latency |
| 323 | expr: | |
| 324 | histogram_quantile(0.99, |
| 325 | sum(rate([service]_http_request_duration_seconds_bucket[5m])) by (le, endpoint) |
| 326 | ) > [0.5] |
| 327 | for: 3m |
| 328 | labels: |
| 329 | severity: warning |
| 330 | team: [team-name] |
| 331 | annotations: |
| 332 | summary: "p99 latency elevated on [Service Name]" |
| 333 | description: "p99 latency on {{ $labels.endpoint }} is {{ $value | humanizeDuration }}" |
| 334 | runbook_url: "[runbook link]" |
| 335 | |
| 336 | |
| 337 | |
| 338 | # Datadog monitor configuration (Python SDK or Terraform) |
| 339 | import datadog |
| 340 | |
| 341 | datadog.initialize(api_key="[key]", app_key="[key]") |
| 342 | |
| 343 | datadog.api.Monitor.create( |
| 344 | type="metric alert", |
| 345 | query=f"sum(last_5m):sum:{{service}}.http.errors{{service:[service-name]}} / sum:{{service}}.http.requests{{service:[service-name]}} > 0.01", |
| 346 | name="[Service] High Error Rate", |
| 347 | message="Error rate exceeded 1%. @pagerduty-[service-oncall]\n\nRunbook: [link]", |
| 348 | tags=["service:[service-name]", "team:[team-name]"], |
| 349 | options={ |
| 350 | "thresholds": {"critical": 0.01, "warning": 0.005}, |
| 351 | "notify_no_data": False, |
| 352 | "evaluation_delay": 60, |
| 353 | } |
| 354 | ) |
| 355 | |
| 356 | |
| 357 | |
| 358 | |
| 359 | ## 7. Dashboard Layout Specification |
| 360 | |
| 361 | The primary service dashboard must answer "is the service healthy right now?" at a glance. Use this layout: |
| 362 | |
| 363 | |
| 364 | ┌─────────────────────────────────────────────────────────────────────┐ |
| 365 | │ [SERVICE NAME] — Service Health Dashboard [Time range ▼] │ |
| 366 | ├───────────────┬───────────────┬───────────────┬─────────────────────┤ |
| 367 | │ Error rate │ p99 Latency │ RPS (current)│ SLO budget remaining│ |
| 368 | │ [BIG NUMBER] │ [BIG NUMBER] │ [BIG NUMBER] │ [BIG NUMBER / days] │ |
| 369 | │ vs SLO: 0.1% │ vs SLO: 500ms│ vs avg: [N] │ [Error budget gauge]│ |
| 370 | ├───────────────┴───────────────┴───────────────┴─────────────────────┤ |
| 371 | │ Error rate over time (24h) │ |
| 372 | │ [Time series: 5xx rate line, SLO threshold line] │ |
| 373 | ├─────────────────────────────────┬───────────────────────────────────┤ |
| 374 | │ Latency percentiles over time │ Request throughput over time │ |
| 375 | │ [Lines: p50, p95, p99, p999] │ [Bars: RPS by endpoint] │ |
| 376 | │ [SLO threshold horizontal line]│ │ |
| 377 | ├─────────────────────────────────┴───────────────────────────────────┤ |
| 378 | │ Latency heatmap (all requests — shows distribution shape) │ |
| 379 | ├─────────────────────────────────┬───────────────────────────────────┤ |
| 380 | │ CPU utilisation over time │ Memory utilisation over time │ |
| 381 | │ [All instances/pods — lines] │ [All instances/pods — lines] │ |
| 382 | │ [Alert threshold: 80%] │ [Alert threshold: 85%] │ |
| 383 | ├─────────────────────────────────┴───────────────────────────────────┤ |
| 384 | │ DB: connection pool utilisation│ DB: query latency (p99 per query)│ |
| 385 | ├─────────────────────────────────┴───────────────────────────────────┤ |
| 386 | │ [Business metric 1 over time] │ [Business metric 2 over time] │ |
| 387 | │ e.g. Payment success rate │ e.g. Orders created/min │ |
| 388 | └─────────────────────────────────┴───────────────────────────────────┘ |
| 389 | |
| 390 | |
| 391 | **Second dashboard — Dependency Health:** |
| 392 | |
| 393 | |
| 394 | ┌─────────────────────────────────────────────────────────────────────┐ |
| 395 | │ [SERVICE NAME] — Dependency Health │ |
| 396 | ├─────────────────────────────────────────────────────────────────────┤ |
| 397 | │ For each dependency: error rate | latency | current status │ |
| 398 | │ [Database] [N]% errors | [N]ms p99 | ● Healthy / ⚠ Degraded │ |
| 399 | │ [Redis] [N]% errors | [N]ms p99 | ● Healthy │ |
| 400 | │ [External API][N]% errors | [N]ms p99 | ● Healthy │ |
| 401 | ├─────────────────────────────────────────────────────────────────────┤ |
| 402 | │ Outbound call latency over time (one line per dependency) │ |
| 403 | ├─────────────────────────────────────────────────────────────────────┤ |
| 404 | │ Circuit breaker / fallback state (if implemented) │ |
| 405 | └─────────────────────────────────────────────────────────────────────┘ |
| 406 | |
| 407 | |
| 408 | |
| 409 | |
| 410 | ## 8. Observability Debt Analysis |
| 411 | |
| 412 | Honest assessment of what is missing today and what the priority to add it is: |
| 413 | |
| 414 | | Gap | Impact | Priority | Effort | Owner | Target date | |
| 415 | |---|---|---|---|---|---| |
| 416 | | [e.g. No distributed tracing — can't see cross-service latency] | High — blind to dependency issues | P1 | [2 days] | [Name] | [Date] | |
| 417 | | [e.g. No business metric alerts — only infra alerts] | High — silent business failures | P1 | [1 day] | [Name] | [Date] | |
| 418 | | [e.g. Logs are unstructured text — not searchable] | Medium — slow incident investigation | P2 | [3 days] | [Name] | [Date] | |
| 419 | | [e.g. No dead-letter queue monitoring] | Medium — failed messages go unnoticed | P2 | [4 hours] | [Name] | [Date] | |
| 420 | | [e.g. Alert thresholds not calibrated to production baseline] | Medium — alert fatigue or missed alerts | P2 | [1 day] | [Name] | [Date] | |
| 421 | | [e.g. No latency heatmap — outliers invisible in averages] | Low — harder to spot tail latency issues | P3 | [2 hours] | [Name] | [Date] | |
| 422 | |
| 423 | **Total observability debt: [N] items | Estimated effort: [N days]** |
| 424 | |
| 425 | |
| 426 | |
| 427 | ## Quality Checks |
| 428 | |
| 429 | [ ] Every alert has a named on-call action — no alert says "investigate" without specifying what to investigate first |
| 430 | [ ] Alert thresholds are calibrated against production baselines, not set to default values from a template |
| 431 | [ ] Structured logging is implemented — no unstructured text log lines in production |
| 432 | [ ] PII is explicitly excluded from logs — a named engineer has verified this |
| 433 | [ ] Distributed tracing is propagating trace IDs across all service boundaries (verify with a test request) |
| 434 | [ ] The primary dashboard answers "is the service healthy?" in under 10 seconds — no hunting for the right panel |
| 435 | [ ] Business metrics are tracked alongside infrastructure metrics — not just four golden signals |
| 436 | [ ] Observability debt items have owners and dates — not just "would be nice to have" |
| 437 | |
| 438 | ## Anti-Patterns |
| 439 | |
| 440 | [ ] Do not create alerts without a specific on-call action — an alert that just says "investigate" trains engineers to ignore it |
| 441 | [ ] Do not set alert thresholds from a template without calibrating against production baselines — uncalibrated thresholds cause either alert fatigue or missed incidents |
| 442 | [ ] Do not log PII, tokens, or secrets — a logging standard is incomplete without an explicit list of what must never be logged |
| 443 | [ ] Do not measure only the four golden signals without adding at least one business metric alert — infrastructure health can be green while the business-critical path is silently failing |
| 444 | [ ] Do not deploy distributed tracing without verifying that trace IDs propagate across all service boundaries — partial tracing is worse than no tracing because it produces misleading incomplete traces |
| 445 |
Discussion
Browse more free Claude skills or everything in Development.