Retention Analysis Skill
Structure a retention analysis, churn investigation, or engagement deep-dive for any product team.
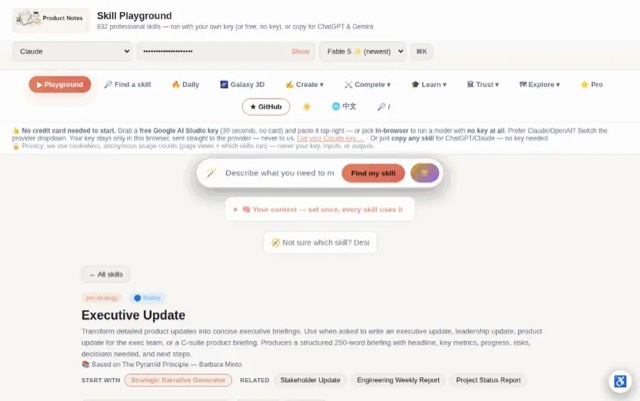


From the mohitagw15856/pm-claude-skills README — shows the whole collection, not only this skill. · view on GitHub
How to use it
Claude Code
- Run the line below. It pulls the whole folder into
~/.claude/skills/retention-analysis. - Describe your job in plain words. Claude Code follows the skill from there.
npx degit mohitagw15856/pm-claude-skills/skills/retention-analysis#main ~/.claude/skills/retention-analysisFor one project only, change the path to .claude/skills/retention-analysis.
Claude (web or desktop app)
- On this page open ⋯ → Download .md.
- Save it as SKILL.md in a folder, zip the folder, then Customize → Skills → + → Create skill → Upload a skill.
- Pick the file and Save. Claude shows the name and description and runs a security scan.
- Check the skill is switched on.
- Start a new chat and describe your job in plain words. The AI follows the skill from there.
ChatGPT or another app
- ChatGPT: make a Project and paste it into Instructions.
- Neither? Paste it at the top of a new chat — it works for that chat.
Not working?
- Check which app you pasted it into — the steps above name the right one.
- Some skills need the paid tier of Claude or ChatGPT.
Paste into Claude, ChatGPT or Cursor.
Source of Retention Analysis Skill
Show the full text161 lines
| name | description |
|---|---|
| retention-analysis | Structure a retention analysis, churn investigation, or engagement deep-dive for any product team. Use when asked to analyse user retention, investigate churn, measure DAU/MAU, or build a retention improvement plan. Produces a retention snapshot with root cause hypotheses, aha-moment correlation, and prioritised interventions. |
Retention Analysis Skill
Diagnose why users leave, identify what keeps them, and recommend specific, testable interventions — not vague "improve onboarding" suggestions.
Retention Fundamentals
The retention curve has two components:
- Steepness of initial drop (D1–D7) — onboarding problem
- Long-term floor level — product-market fit indicator
A product with PMF has a retention curve that flattens. If it trends to zero, you have a PMF problem, not an onboarding problem. Name this distinction explicitly.
Retention Metrics Definitions
| Metric | Formula | What It Tells You |
|---|---|---|
| D1 Retention | Users who return on day 2 ÷ new users day 1 | Quality of first experience |
| D7 Retention | Users active on day 8 ÷ users who joined 7 days ago | Early habit formation |
| D30 Retention | Users active on day 31 ÷ users who joined 30 days ago | Product-market fit signal |
| DAU/MAU Ratio | Daily active users ÷ monthly active users | Stickiness (>20% good, >50% excellent) |
| Churn Rate | Users lost in period ÷ users at start of period | Monthly or annual |
| Net Revenue Retention | MRR at end of period ÷ MRR at start (same cohort) | Revenue health including expansion |
Retention Investigation Framework
Step 1: Segment the problem
Don't analyse "retention" — analyse retention for specific cohorts:
- New vs returning users
- Paid vs free
- Acquisition channel (organic vs paid vs referral)
- Onboarding path completed vs not
- Feature usage (power users vs lurkers)
Step 2: Find the inflection points
Where does the drop happen? D1? D7? Month 3?
- D1 drop → First session experience
- D7 drop → Habit loop not formed
- D30 drop → Value not delivered at depth
- Month 3+ drop → Boredom, competition, or lifecycle event
Step 3: Identify the "aha moment" correlation
Which early behaviour predicts long-term retention?
- Run correlation: users who did [X] in first 7 days vs 30-day retention
- Common patterns: connected an integration, invited a teammate, completed a core action N times
Step 4: Qualify the churn
Interview churned users — never skip this. Survey data alone is insufficient.
- "What was the trigger that led you to cancel/stop?"
- "What were you trying to accomplish that you couldn't?"
- "What would need to change for you to come back?"
Output Format
Retention Analysis — [Product/Segment] — [Date]
Question: [Specific retention question being answered] Period Analysed: [Date range] Segment: [Which users]
Current Retention Snapshot:
| Metric | Current | Industry Benchmark | Status |
|---|---|---|---|
| D1 Retention | [X%] | 25–40% | 🔴/🟡/🟢 |
| D7 Retention | [X%] | 10–25% | 🔴/🟡/🟢 |
| D30 Retention | [X%] | 5–15% | 🔴/🟡/🟢 |
| DAU/MAU | [X%] | 10–20% typical | 🔴/🟡/🟢 |
Retention Curve Shape: [Flattening / Still declining / Trending to zero] PMF Signal: [Strong / Weak / Absent — based on curve shape]
Root Cause Hypotheses:
| Hypothesis | Evidence | Confidence | Test |
|---|---|---|---|
| [Cause] | [Data point] | H/M/L | [How to validate] |
"Aha Moment" Correlation: Users who [specific action] in first [N] days retain at [X%] vs [Y%] for those who don't.
Recommended Interventions:
| Intervention | Target Drop | Expected Lift | Effort | Priority |
|---|---|---|---|---|
| [Specific change] | D1 / D7 / D30 | [X%] | S/M/L | 1/2/3 |
Monitoring Plan:
- Metric to track: [X]
- Review cadence: [Weekly / Monthly]
- Alert threshold: [If X drops below Y, investigate immediately]
Required Inputs
Ask the user for these if not provided:
- Product and business model (SaaS / consumer app / marketplace / other)
- Current retention metrics (D1, D7, D30 if available)
- Segment to analyse (all users / paid / free / a specific cohort)
- Key question to answer (why is retention dropping? what drives retention?)
- Available data (analytics events, churn surveys, interview notes)
Deeper Materials
This skill ships with support files — use them when they are available:
references/curve-reading.md— Reading Retention Curves Without Fooling Yourself. Apply it while producing the output; it carries the calibration and judgment calls the method summary above compresses.templates/retention-readout.md— a fill-in version of the deliverable with the quality gates inline. Offer it when the user wants to work the document themselves rather than have it generated.
Scoring Rubric (0–40)
Score any output of this skill before handing it over; 32+ is ship-quality.
| Dimension | 0 | 5 | 10 |
|---|---|---|---|
| Curve diagnosis | Reports a retention number without curve shape | Shape shown but not interpreted | Flattening vs trending-to-zero explicitly diagnosed and tied to what it means (PMF vs onboarding problem) |
| Cohort discipline | All users lumped into one blended rate | Cohorts split but read as a table dump | Cohorts segmented before analysis, with the divergent cohort called out and explained |
| Aha-moment linkage | Activation never connects to retention | Correlation claimed without data or caveat | The behavior separating retained from churned users identified with evidence, or honestly flagged unknown with a plan to find it |
| Intervention specificity | "Improve onboarding"-grade advice | Specific actions but no measurement plan | Interventions name the user moment they target, plus a monitoring plan with an alert threshold and churned-user interviews |
Quality Checks
- Retention curve shape is diagnosed (flattening vs trending to zero = PMF vs onboarding)
- Cohorts are segmented before analysis (not all users lumped together)
- "Aha moment" correlation is identified or flagged as unknown
- Interventions are specific (not "improve onboarding")
- Churned user interviews are recommended (not just data analysis)
- Monitoring plan includes an alert threshold
Anti-Patterns
- Do not recommend "improve onboarding" without specifying what specific step to change and why
- Do not analyse retention without segmenting by cohort — aggregate retention curves hide cohort-specific patterns
- Do not treat DAU/MAU below 5% as a retention problem — at that level, it is a product-market fit problem
- Do not skip qualitative research — churned user interviews reveal reasons that quantitative data cannot
- Do not set a monitoring alert without specifying the threshold that triggers it
Guidelines
- Never recommend "improve onboarding" without specifying what to change and why
- Benchmark against industry — consumer apps, SaaS, and marketplaces have very different retention norms
- If DAU/MAU is below 5%, that's a PMF conversation, not a retention tactics conversation
- Always recommend talking to churned users — no amount of data replaces understanding the reason
| 1 | |
| 2 | name retention-analysis |
| 3 | description "Structure a retention analysis, churn investigation, or engagement deep-dive for any product team. Use when asked to analyse user retention, investigate churn, measure DAU/MAU, or build a retention improvement plan. Produces a retention snapshot with root cause hypotheses, aha-moment correlation, and prioritised interventions." |
| 4 | |
| 5 | |
| 6 | # Retention Analysis Skill |
| 7 | |
| 8 | Diagnose why users leave, identify what keeps them, and recommend specific, testable interventions — not vague "improve onboarding" suggestions. |
| 9 | |
| 10 | ## Retention Fundamentals |
| 11 | |
| 12 | **The retention curve has two components:** |
| 13 | **Steepness of initial drop** (D1–D7) — onboarding problem |
| 14 | **Long-term floor level** — product-market fit indicator |
| 15 | |
| 16 | A product with PMF has a retention curve that flattens. If it trends to zero, you have a PMF problem, not an onboarding problem. Name this distinction explicitly. |
| 17 | |
| 18 | |
| 19 | |
| 20 | ## Retention Metrics Definitions |
| 21 | |
| 22 | | Metric | Formula | What It Tells You | |
| 23 | |---|---|---| |
| 24 | | D1 Retention | Users who return on day 2 ÷ new users day 1 | Quality of first experience | |
| 25 | | D7 Retention | Users active on day 8 ÷ users who joined 7 days ago | Early habit formation | |
| 26 | | D30 Retention | Users active on day 31 ÷ users who joined 30 days ago | Product-market fit signal | |
| 27 | | DAU/MAU Ratio | Daily active users ÷ monthly active users | Stickiness (>20% good, >50% excellent) | |
| 28 | | Churn Rate | Users lost in period ÷ users at start of period | Monthly or annual | |
| 29 | | Net Revenue Retention | MRR at end of period ÷ MRR at start (same cohort) | Revenue health including expansion | |
| 30 | |
| 31 | |
| 32 | |
| 33 | ## Retention Investigation Framework |
| 34 | |
| 35 | ### Step 1: Segment the problem |
| 36 | Don't analyse "retention" — analyse retention for specific cohorts: |
| 37 | New vs returning users |
| 38 | Paid vs free |
| 39 | Acquisition channel (organic vs paid vs referral) |
| 40 | Onboarding path completed vs not |
| 41 | Feature usage (power users vs lurkers) |
| 42 | |
| 43 | ### Step 2: Find the inflection points |
| 44 | Where does the drop happen? D1? D7? Month 3? |
| 45 | D1 drop → First session experience |
| 46 | D7 drop → Habit loop not formed |
| 47 | D30 drop → Value not delivered at depth |
| 48 | Month 3+ drop → Boredom, competition, or lifecycle event |
| 49 | |
| 50 | ### Step 3: Identify the "aha moment" correlation |
| 51 | Which early behaviour predicts long-term retention? |
| 52 | Run correlation: users who did [X] in first 7 days vs 30-day retention |
| 53 | Common patterns: connected an integration, invited a teammate, completed a core action N times |
| 54 | |
| 55 | ### Step 4: Qualify the churn |
| 56 | Interview churned users — never skip this. Survey data alone is insufficient. |
| 57 | "What was the trigger that led you to cancel/stop?" |
| 58 | "What were you trying to accomplish that you couldn't?" |
| 59 | "What would need to change for you to come back?" |
| 60 | |
| 61 | |
| 62 | |
| 63 | ## Output Format |
| 64 | |
| 65 | ### Retention Analysis — [Product/Segment] — [Date] |
| 66 | |
| 67 | **Question:** [Specific retention question being answered] |
| 68 | **Period Analysed:** [Date range] |
| 69 | **Segment:** [Which users] |
| 70 | |
| 71 | |
| 72 | |
| 73 | **Current Retention Snapshot:** |
| 74 | |
| 75 | | Metric | Current | Industry Benchmark | Status | |
| 76 | |---|---|---|---| |
| 77 | | D1 Retention | [X%] | 25–40% | 🔴/🟡/🟢 | |
| 78 | | D7 Retention | [X%] | 10–25% | 🔴/🟡/🟢 | |
| 79 | | D30 Retention | [X%] | 5–15% | 🔴/🟡/🟢 | |
| 80 | | DAU/MAU | [X%] | 10–20% typical | 🔴/🟡/🟢 | |
| 81 | |
| 82 | **Retention Curve Shape:** [Flattening / Still declining / Trending to zero] |
| 83 | **PMF Signal:** [Strong / Weak / Absent — based on curve shape] |
| 84 | |
| 85 | |
| 86 | |
| 87 | **Root Cause Hypotheses:** |
| 88 | |
| 89 | | Hypothesis | Evidence | Confidence | Test | |
| 90 | |---|---|---|---| |
| 91 | | [Cause] | [Data point] | H/M/L | [How to validate] | |
| 92 | |
| 93 | **"Aha Moment" Correlation:** |
| 94 | Users who [specific action] in first [N] days retain at [X%] vs [Y%] for those who don't. |
| 95 | |
| 96 | |
| 97 | |
| 98 | **Recommended Interventions:** |
| 99 | |
| 100 | | Intervention | Target Drop | Expected Lift | Effort | Priority | |
| 101 | |---|---|---|---|---| |
| 102 | | [Specific change] | D1 / D7 / D30 | [X%] | S/M/L | 1/2/3 | |
| 103 | |
| 104 | **Monitoring Plan:** |
| 105 | Metric to track: [X] |
| 106 | Review cadence: [Weekly / Monthly] |
| 107 | Alert threshold: [If X drops below Y, investigate immediately] |
| 108 | |
| 109 | |
| 110 | |
| 111 | ## Required Inputs |
| 112 | |
| 113 | Ask the user for these if not provided: |
| 114 | **Product and business model** (SaaS / consumer app / marketplace / other) |
| 115 | **Current retention metrics** (D1, D7, D30 if available) |
| 116 | **Segment to analyse** (all users / paid / free / a specific cohort) |
| 117 | **Key question to answer** (why is retention dropping? what drives retention?) |
| 118 | **Available data** (analytics events, churn surveys, interview notes) |
| 119 | |
| 120 | ## Deeper Materials |
| 121 | |
| 122 | This skill ships with support files — use them when they are available: |
| 123 | |
| 124 | **`references/curve-reading.md`** — Reading Retention Curves Without Fooling Yourself. Apply it while producing the output; it carries the calibration and judgment calls the method summary above compresses. |
| 125 | **`templates/retention-readout.md`** — a fill-in version of the deliverable with the quality gates inline. Offer it when the user wants to work the document themselves rather than have it generated. |
| 126 | |
| 127 | ## Scoring Rubric (0–40) |
| 128 | |
| 129 | Score any output of this skill before handing it over; 32+ is ship-quality. |
| 130 | |
| 131 | | Dimension | 0 | 5 | 10 | |
| 132 | |---|---|---|---| |
| 133 | | Curve diagnosis | Reports a retention number without curve shape | Shape shown but not interpreted | Flattening vs trending-to-zero explicitly diagnosed and tied to what it means (PMF vs onboarding problem) | |
| 134 | | Cohort discipline | All users lumped into one blended rate | Cohorts split but read as a table dump | Cohorts segmented before analysis, with the divergent cohort called out and explained | |
| 135 | | Aha-moment linkage | Activation never connects to retention | Correlation claimed without data or caveat | The behavior separating retained from churned users identified with evidence, or honestly flagged unknown with a plan to find it | |
| 136 | | Intervention specificity | "Improve onboarding"-grade advice | Specific actions but no measurement plan | Interventions name the user moment they target, plus a monitoring plan with an alert threshold and churned-user interviews | |
| 137 | |
| 138 | ## Quality Checks |
| 139 | |
| 140 | [ ] Retention curve shape is diagnosed (flattening vs trending to zero = PMF vs onboarding) |
| 141 | [ ] Cohorts are segmented before analysis (not all users lumped together) |
| 142 | [ ] "Aha moment" correlation is identified or flagged as unknown |
| 143 | [ ] Interventions are specific (not "improve onboarding") |
| 144 | [ ] Churned user interviews are recommended (not just data analysis) |
| 145 | [ ] Monitoring plan includes an alert threshold |
| 146 | |
| 147 | ## Anti-Patterns |
| 148 | |
| 149 | [ ] Do not recommend "improve onboarding" without specifying what specific step to change and why |
| 150 | [ ] Do not analyse retention without segmenting by cohort — aggregate retention curves hide cohort-specific patterns |
| 151 | [ ] Do not treat DAU/MAU below 5% as a retention problem — at that level, it is a product-market fit problem |
| 152 | [ ] Do not skip qualitative research — churned user interviews reveal reasons that quantitative data cannot |
| 153 | [ ] Do not set a monitoring alert without specifying the threshold that triggers it |
| 154 | |
| 155 | ## Guidelines |
| 156 | |
| 157 | Never recommend "improve onboarding" without specifying *what* to change and *why* |
| 158 | Benchmark against industry — consumer apps, SaaS, and marketplaces have very different retention norms |
| 159 | If DAU/MAU is below 5%, that's a PMF conversation, not a retention tactics conversation |
| 160 | Always recommend talking to churned users — no amount of data replaces understanding the *reason* |
| 161 |
Discussion
Browse more free Claude skills or everything in Customer support.