Performance Budget Skill
Define and document performance budgets for a web service or application.
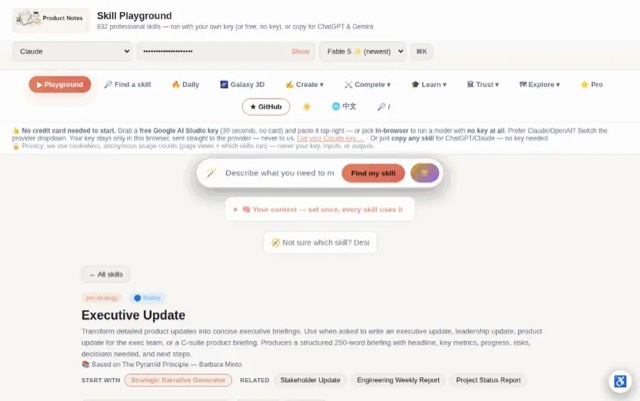
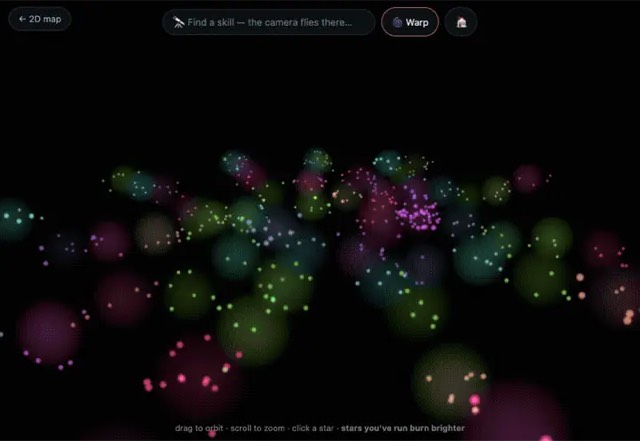
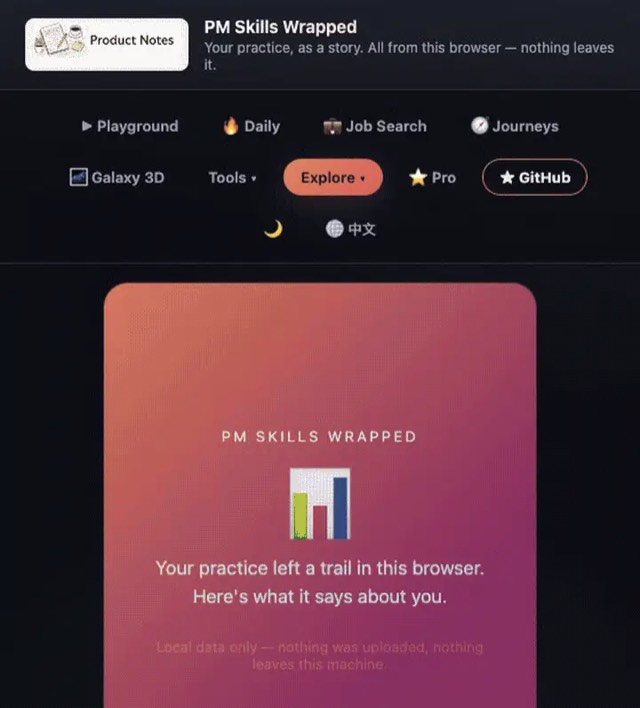
From the mohitagw15856/pm-claude-skills README — shows the whole collection, not only this skill. · view on GitHub
How to use it
Claude Code
- Run the line below. It pulls the whole folder into
~/.claude/skills/performance-budget, including the files SKILL.md points to. - Describe your job in plain words. Claude Code follows the skill from there.
npx degit mohitagw15856/pm-claude-skills/skills/performance-budget#main ~/.claude/skills/performance-budgetFor one project only, change the path to .claude/skills/performance-budget. This skill also uses lighthouserc.js — copying SKILL.md alone won't be enough. See the folder on GitHub.
Claude (web or desktop app)
- On this page open ⋯ → Download .md.
- Save it as SKILL.md in a folder, zip the folder, then Customize → Skills → + → Create skill → Upload a skill.
- Pick the file and Save. Claude shows the name and description and runs a security scan.
- Check the skill is switched on.
- Start a new chat and describe your job in plain words. The AI follows the skill from there.
ChatGPT or another app
- ChatGPT: make a Project and paste it into Instructions.
- Neither? Paste it at the top of a new chat — it works for that chat.
Not working?
- Check which app you pasted it into — the steps above name the right one.
- Some skills need the paid tier of Claude or ChatGPT.
Paste into Claude, ChatGPT or Cursor.
Source of Performance Budget Skill
Show the full text286 lines
| name | description |
|---|---|
| performance-budget | Define and document performance budgets for a web service or application. Use when asked to set performance targets, define SLOs for latency or throughput, establish Core Web Vitals targets, create a performance baseline, or document performance regression policy. Produces a structured performance budget covering key user journeys, Core Web Vitals, backend latency SLOs, measurement tooling, CI enforcement, and breach response process. |
Performance Budget Skill
Produce a complete, actionable performance budget document for a web service or application. A performance budget is not a wishlist — it is a set of measurable, enforced constraints that define what "acceptable performance" means and who is responsible when those constraints are violated.
A good performance budget answers: what are the targets, how are they measured, what triggers an investigation, and what happens when a budget is breached.
Required Inputs
Ask for these if not already provided:
- Service name and type — web app, API service, mobile app, or combination
- Key user journeys — the 3–5 most important flows users take (e.g. "search → product page → checkout")
- Current baseline metrics — P50/P95/P99 latency, LCP, CLS, INP if available (state "no baseline" if not collected yet)
- Tech stack — frontend framework, backend language/framework, CDN, database
- Deployment environment — cloud provider, region(s), edge/CDN configuration
- Cost constraints — any budget or infrastructure limits that affect headroom
Output Format
Performance Budget: [Service Name]
Service: [Name] | Team: [Team name] Last updated: [Date] | Owner: [Name / role] Environment: [Production / Staging baseline] | Review cadence: [Quarterly / per-sprint]
Overview
[2–3 sentences describing the service, its user-facing performance requirements, and why performance is a priority. Reference the business impact of latency — e.g. conversion rate, user retention, SLA obligations.]
Performance philosophy: [e.g. "Performance is a feature. Every engineer is responsible for keeping the service within budget. Regressions must be caught in CI before they reach production."]
Key User Journeys
Define the critical paths that the performance budget is designed to protect.
| Journey ID | Journey name | Entry point | Exit point | Criticality |
|---|---|---|---|---|
| UJ-1 | [e.g. New user sign-up] | [Landing page] | [Dashboard] | Critical |
| UJ-2 | [e.g. Core workflow task] | [e.g. /app/tasks] | [e.g. Task complete] | High |
| UJ-3 | [e.g. Search and select] | [e.g. /search] | [e.g. Detail page] | High |
| UJ-4 | [e.g. API data fetch] | [e.g. GET /api/items] | [e.g. 200 response] | Medium |
Frontend Performance Budget
Complete this section for web and mobile applications. Skip for API-only services.
Core Web Vitals Targets
Targets apply to the 75th percentile of real user sessions (field data), measured on a mid-range Android device on a 4G connection unless otherwise stated.
| Metric | Description | Good | Needs Improvement | Poor | Our Target | Current baseline |
|---|---|---|---|---|---|---|
| LCP | Largest Contentful Paint — perceived load speed | ≤2.5s | 2.5–4.0s | >4.0s | [≤X.Xs] | [Xs / not measured] |
| INP | Interaction to Next Paint — responsiveness | ≤200ms | 200–500ms | >500ms | [≤Xms] | [Xms / not measured] |
| CLS | Cumulative Layout Shift — visual stability | ≤0.1 | 0.1–0.25 | >0.25 | [≤0.X] | [X.XX / not measured] |
| FCP | First Contentful Paint | ≤1.8s | 1.8–3.0s | >3.0s | [≤X.Xs] | [Xs / not measured] |
| TTFB | Time to First Byte | ≤800ms | 800ms–1.8s | >1.8s | [≤Xms] | [Xms / not measured] |
Page Weight Budget
| Asset type | Max size (compressed) | Current | Status |
|---|---|---|---|
| Total page weight | [e.g. 500KB] | [XKB / unknown] | [Within / Over / Unknown] |
| JavaScript (initial load) | [e.g. 200KB] | [XKB / unknown] | [Within / Over / Unknown] |
| CSS | [e.g. 50KB] | [XKB / unknown] | [Within / Over / Unknown] |
| Images (above fold) | [e.g. 150KB] | [XKB / unknown] | [Within / Over / Unknown] |
| Web fonts | [e.g. 50KB] | [XKB / unknown] | [Within / Over / Unknown] |
| Third-party scripts | [e.g. 100KB] | [XKB / unknown] | [Within / Over / Unknown] |
Per-Journey Frontend Targets
| Journey | LCP | INP | CLS | FCP | TTFB |
|---|---|---|---|---|---|
| UJ-1: [Journey name] | [≤Xs] | [≤Xms] | [≤0.X] | [≤Xs] | [≤Xms] |
| UJ-2: [Journey name] | [≤Xs] | [≤Xms] | [≤0.X] | [≤Xs] | [≤Xms] |
| UJ-3: [Journey name] | [≤Xs] | [≤Xms] | [≤0.X] | [≤Xs] | [≤Xms] |
Backend Performance Budget
API Latency SLOs
Targets measured at the service boundary (not including client-side network latency).
| Endpoint / operation | Method | P50 | P95 | P99 | Max (hard limit) | Error rate |
|---|---|---|---|---|---|---|
| [e.g. /api/auth/login] | POST | [≤Xms] | [≤Xms] | [≤Xms] | [≤Xms] | [<X%] |
| [e.g. /api/items] | GET | [≤Xms] | [≤Xms] | [≤Xms] | [≤Xms] | [<X%] |
| [e.g. /api/items/:id] | GET | [≤Xms] | [≤Xms] | [≤Xms] | [≤Xms] | [<X%] |
| [e.g. /api/items] | POST | [≤Xms] | [≤Xms] | [≤Xms] | [≤Xms] | [<X%] |
| [e.g. Background job: sync] | — | [≤Xs] | [≤Xs] | [≤Xs] | [≤Xs] | [<X%] |
Overall service SLOs:
| SLO | Target | Measurement window |
|---|---|---|
| Availability | [99.X%] | 30-day rolling |
| P95 latency (all endpoints) | [≤Xms] | 30-day rolling |
| Error rate (5xx) | [<X%] | 30-day rolling |
| Throughput (sustained) | [≥X req/s] | Peak hour |
Database Query Budget
| Query / operation | P50 | P95 | Max | Notes |
|---|---|---|---|---|
| [e.g. User lookup by ID] | [≤Xms] | [≤Xms] | [≤Xms] | Index on user_id |
| [e.g. List items for user] | [≤Xms] | [≤Xms] | [≤Xms] | Paginated, max 100 rows |
| [e.g. Full-text search] | [≤Xms] | [≤Xms] | [≤Xms] | Elasticsearch / pg_trgm |
Measurement Methodology
Real User Monitoring (RUM)
Tool: [e.g. Google CrUX, SpeedCurve, Datadog RUM, Sentry Performance, custom] Data source: [Field data from real users / Lab data from synthetic tests / Both] Sample rate: [X% of sessions] How to access: [Dashboard URL or tool access instructions]
What is measured:
- Core Web Vitals (LCP, INP, CLS) per page and journey
- Custom performance marks for business-critical interactions
- Resource timing for key assets
- Long tasks (>50ms on main thread)
Synthetic Monitoring
Tool: [e.g. Lighthouse CI, WebPageTest, k6, Artillery, Playwright with performance assertions] Frequency: [Every X minutes / on every deploy / nightly] Test location(s): [e.g. eu-west-1, us-east-1] Device profile: [Desktop 10Mbps / Mobile 4G Moto G4 / both]
Synthetic test suite location: [Link to test files]
Backend Observability
APM tool: [e.g. Datadog, Grafana + Prometheus, New Relic, AWS X-Ray] Metrics collected:
- Request rate, error rate, duration (RED metrics) per endpoint
- Database query duration and connection pool utilisation
- Cache hit/miss rates
- Background job queue depth and processing latency
Dashboard: [Link to primary performance dashboard]
CI/CD Performance Enforcement
Performance budgets are enforced at two gates:
Gate 1 — Build-time Bundle Analysis
Tool: [e.g. bundlesize, size-limit, webpack-bundle-analyzer with CI assertion]
Config file: [[.bundlesizerc / .size-limit.js / etc.]]
Trigger: Every PR targeting main
Blocking: Yes — PR cannot merge if bundle size budget is exceeded
// Example .size-limit.js
[
  {
    "path": "dist/js/*.js",
    "limit": "200 KB"
  },
  {
    "path": "dist/css/*.css",
    "limit": "50 KB"
  }
]
Gate 2 — Synthetic Performance Tests in CI
Tool: [e.g. Lighthouse CI, k6, Artillery] Trigger: On deploy to staging Blocking: Yes — production deploy is blocked if thresholds fail Thresholds checked:
- LCP ≤ [Xs]
- CLS ≤ [0.X]
- P95 API latency ≤ [Xms]
- Error rate < [X%]
CI config location: [[.github/workflows/perf.yml / ci/performance.yaml]]
How to run locally:
# Run Lighthouse CI against local build
[command — e.g. lhci autorun --config=lighthouserc.js]

# Run load test locally
[command — e.g. k6 run load-tests/api-smoke.js]
Budget Breach Response Process
A budget breach is when a measured metric exceeds its target for [X consecutive measurements / X minutes sustained / a single deploy].
Breach Severity Levels
| Severity | Condition | Response time | Who acts |
|---|---|---|---|
| P1 — Critical | >2× budget threshold in production | Immediate | On-call engineer + team lead |
| P2 — High | >1.5× budget threshold in production | Within 4 hours | On-call engineer |
| P3 — Medium | Threshold exceeded in production | Within 1 sprint | PR author + team |
| P4 — Low | Threshold exceeded in staging only | Before merge | PR author |
Breach Investigation Checklist
When a breach is detected, work through this checklist in order:
1. Identify the regression commit
# Compare performance across recent deploys
[command — e.g. datadog metrics query, lighthouse-ci compare, git bisect]
2. Classify the breach
- Is this a code change? (new feature, refactor, dependency bump)
- Is this an infrastructure change? (new instance type, config change)
- Is this an external factor? (CDN issue, DNS, upstream dependency)
- Is this a measurement anomaly? (test environment issue, sample size)
3. Immediate actions
- If P1/P2 in production and a code cause is confirmed: roll back or disable the feature flag
- If cause is unknown: do not roll back immediately — gather more data first
- Notify [#performance / #incidents Slack channel] with: metric name, current value, budget target, suspected cause
4. Resolution
- Fix the root cause — do not just adjust the budget threshold
- Budget thresholds should only change after a team discussion and explicit approval from [tech lead / EM]
- Document the breach in the [performance log / incident record]
Budget change policy: Budget thresholds may only be relaxed if: (a) the feature delivering the regression has measurable business value that outweighs the performance cost, and (b) the change is reviewed and approved by [tech lead].
Performance Review Cadence
| Trigger | Action |
|---|---|
| Every sprint | Review P95/P99 latency trends; flag any creeping degradation |
| Every quarter | Full performance budget review — update baselines, adjust targets, audit tooling |
| After major feature launch | Re-measure all Core Web Vitals and API SLOs; update baselines |
| After infrastructure change | Re-run full synthetic test suite; confirm no regression |
| After dependency upgrade | Run bundle size diff; confirm no unexpected size increase |
Next scheduled review: [Date] Review owner: [Name / role]
Quality Checks
- Every budget threshold is a specific number — not a range or "TBD"
- Both frontend (if applicable) and backend targets are defined — not just one or the other
- Measurement tooling is named with a link to the dashboard or config file
- CI enforcement is configured for at least one gate (build-time or deploy-time)
- Budget breach response process names specific Slack channels and owners
- Budget thresholds are anchored to baseline measurements or a justified target — not pulled from thin air
- Per-journey targets are defined for critical user journeys, not just global averages
Anti-Patterns
- Do not set budget thresholds without measuring a current baseline first — targets must be anchored to reality
- Do not define global averages only — critical user journeys need individual budgets as they may diverge significantly
- Do not omit CI enforcement — a performance budget that is not enforced in the build pipeline will not be respected
- Do not leave the breach response process without named owners and escalation channels
- Do not set budgets that apply only to one environment — production and staging targets should be documented separately if they differ
| 1 | |
| 2 | name performance-budget |
| 3 | description "Define and document performance budgets for a web service or application. Use when asked to set performance targets, define SLOs for latency or throughput, establish Core Web Vitals targets, create a performance baseline, or document performance regression policy. Produces a structured performance budget covering key user journeys, Core Web Vitals, backend latency SLOs, measurement tooling, CI enforcement, and breach response process." |
| 4 | |
| 5 | |
| 6 | # Performance Budget Skill |
| 7 | |
| 8 | Produce a complete, actionable performance budget document for a web service or application. A performance budget is not a wishlist — it is a set of measurable, enforced constraints that define what "acceptable performance" means and who is responsible when those constraints are violated. |
| 9 | |
| 10 | A good performance budget answers: what are the targets, how are they measured, what triggers an investigation, and what happens when a budget is breached. |
| 11 | |
| 12 | ## Required Inputs |
| 13 | |
| 14 | Ask for these if not already provided: |
| 15 | **Service name and type** — web app, API service, mobile app, or combination |
| 16 | **Key user journeys** — the 3–5 most important flows users take (e.g. "search → product page → checkout") |
| 17 | **Current baseline metrics** — P50/P95/P99 latency, LCP, CLS, INP if available (state "no baseline" if not collected yet) |
| 18 | **Tech stack** — frontend framework, backend language/framework, CDN, database |
| 19 | **Deployment environment** — cloud provider, region(s), edge/CDN configuration |
| 20 | **Cost constraints** — any budget or infrastructure limits that affect headroom |
| 21 | |
| 22 | ## Output Format |
| 23 | |
| 24 | |
| 25 | |
| 26 | # Performance Budget: [Service Name] |
| 27 | |
| 28 | **Service:** [Name] | **Team:** [Team name] |
| 29 | **Last updated:** [Date] | **Owner:** [Name / role] |
| 30 | **Environment:** [Production / Staging baseline] | **Review cadence:** [Quarterly / per-sprint] |
| 31 | |
| 32 | |
| 33 | |
| 34 | ## Overview |
| 35 | |
| 36 | [2–3 sentences describing the service, its user-facing performance requirements, and why performance is a priority. Reference the business impact of latency — e.g. conversion rate, user retention, SLA obligations.] |
| 37 | |
| 38 | **Performance philosophy:** [e.g. "Performance is a feature. Every engineer is responsible for keeping the service within budget. Regressions must be caught in CI before they reach production."] |
| 39 | |
| 40 | |
| 41 | |
| 42 | ## Key User Journeys |
| 43 | |
| 44 | Define the critical paths that the performance budget is designed to protect. |
| 45 | |
| 46 | | Journey ID | Journey name | Entry point | Exit point | Criticality | |
| 47 | |---|---|---|---|---| |
| 48 | | UJ-1 | [e.g. New user sign-up] | [Landing page] | [Dashboard] | Critical | |
| 49 | | UJ-2 | [e.g. Core workflow task] | [e.g. /app/tasks] | [e.g. Task complete] | High | |
| 50 | | UJ-3 | [e.g. Search and select] | [e.g. /search] | [e.g. Detail page] | High | |
| 51 | | UJ-4 | [e.g. API data fetch] | [e.g. GET /api/items] | [e.g. 200 response] | Medium | |
| 52 | |
| 53 | |
| 54 | |
| 55 | ## Frontend Performance Budget |
| 56 | |
| 57 | *Complete this section for web and mobile applications. Skip for API-only services.* |
| 58 | |
| 59 | ### Core Web Vitals Targets |
| 60 | |
| 61 | Targets apply to the 75th percentile of real user sessions (field data), measured on a mid-range Android device on a 4G connection unless otherwise stated. |
| 62 | |
| 63 | | Metric | Description | Good | Needs Improvement | Poor | **Our Target** | Current baseline | |
| 64 | |---|---|---|---|---|---|---| |
| 65 | | **LCP** | Largest Contentful Paint — perceived load speed | ≤2.5s | 2.5–4.0s | >4.0s | **[≤X.Xs]** | [Xs / not measured] | |
| 66 | | **INP** | Interaction to Next Paint — responsiveness | ≤200ms | 200–500ms | >500ms | **[≤Xms]** | [Xms / not measured] | |
| 67 | | **CLS** | Cumulative Layout Shift — visual stability | ≤0.1 | 0.1–0.25 | >0.25 | **[≤0.X]** | [X.XX / not measured] | |
| 68 | | **FCP** | First Contentful Paint | ≤1.8s | 1.8–3.0s | >3.0s | **[≤X.Xs]** | [Xs / not measured] | |
| 69 | | **TTFB** | Time to First Byte | ≤800ms | 800ms–1.8s | >1.8s | **[≤Xms]** | [Xms / not measured] | |
| 70 | |
| 71 | ### Page Weight Budget |
| 72 | |
| 73 | | Asset type | Max size (compressed) | Current | Status | |
| 74 | |---|---|---|---| |
| 75 | | Total page weight | [e.g. 500KB] | [XKB / unknown] | [Within / Over / Unknown] | |
| 76 | | JavaScript (initial load) | [e.g. 200KB] | [XKB / unknown] | [Within / Over / Unknown] | |
| 77 | | CSS | [e.g. 50KB] | [XKB / unknown] | [Within / Over / Unknown] | |
| 78 | | Images (above fold) | [e.g. 150KB] | [XKB / unknown] | [Within / Over / Unknown] | |
| 79 | | Web fonts | [e.g. 50KB] | [XKB / unknown] | [Within / Over / Unknown] | |
| 80 | | Third-party scripts | [e.g. 100KB] | [XKB / unknown] | [Within / Over / Unknown] | |
| 81 | |
| 82 | ### Per-Journey Frontend Targets |
| 83 | |
| 84 | | Journey | LCP | INP | CLS | FCP | TTFB | |
| 85 | |---|---|---|---|---|---| |
| 86 | | UJ-1: [Journey name] | [≤Xs] | [≤Xms] | [≤0.X] | [≤Xs] | [≤Xms] | |
| 87 | | UJ-2: [Journey name] | [≤Xs] | [≤Xms] | [≤0.X] | [≤Xs] | [≤Xms] | |
| 88 | | UJ-3: [Journey name] | [≤Xs] | [≤Xms] | [≤0.X] | [≤Xs] | [≤Xms] | |
| 89 | |
| 90 | |
| 91 | |
| 92 | ## Backend Performance Budget |
| 93 | |
| 94 | ### API Latency SLOs |
| 95 | |
| 96 | Targets measured at the service boundary (not including client-side network latency). |
| 97 | |
| 98 | | Endpoint / operation | Method | P50 | P95 | P99 | Max (hard limit) | Error rate | |
| 99 | |---|---|---|---|---|---|---| |
| 100 | | [e.g. /api/auth/login] | POST | [≤Xms] | [≤Xms] | [≤Xms] | [≤Xms] | [<X%] | |
| 101 | | [e.g. /api/items] | GET | [≤Xms] | [≤Xms] | [≤Xms] | [≤Xms] | [<X%] | |
| 102 | | [e.g. /api/items/:id] | GET | [≤Xms] | [≤Xms] | [≤Xms] | [≤Xms] | [<X%] | |
| 103 | | [e.g. /api/items] | POST | [≤Xms] | [≤Xms] | [≤Xms] | [≤Xms] | [<X%] | |
| 104 | | [e.g. Background job: sync] | — | [≤Xs] | [≤Xs] | [≤Xs] | [≤Xs] | [<X%] | |
| 105 | |
| 106 | **Overall service SLOs:** |
| 107 | |
| 108 | | SLO | Target | Measurement window | |
| 109 | |---|---|---| |
| 110 | | Availability | [99.X%] | 30-day rolling | |
| 111 | | P95 latency (all endpoints) | [≤Xms] | 30-day rolling | |
| 112 | | Error rate (5xx) | [<X%] | 30-day rolling | |
| 113 | | Throughput (sustained) | [≥X req/s] | Peak hour | |
| 114 | |
| 115 | ### Database Query Budget |
| 116 | |
| 117 | | Query / operation | P50 | P95 | Max | Notes | |
| 118 | |---|---|---|---|---| |
| 119 | | [e.g. User lookup by ID] | [≤Xms] | [≤Xms] | [≤Xms] | Index on `user_id` | |
| 120 | | [e.g. List items for user] | [≤Xms] | [≤Xms] | [≤Xms] | Paginated, max 100 rows | |
| 121 | | [e.g. Full-text search] | [≤Xms] | [≤Xms] | [≤Xms] | Elasticsearch / pg_trgm | |
| 122 | |
| 123 | |
| 124 | |
| 125 | ## Measurement Methodology |
| 126 | |
| 127 | ### Real User Monitoring (RUM) |
| 128 | |
| 129 | **Tool:** [e.g. Google CrUX, SpeedCurve, Datadog RUM, Sentry Performance, custom] |
| 130 | **Data source:** [Field data from real users / Lab data from synthetic tests / Both] |
| 131 | **Sample rate:** [X% of sessions] |
| 132 | **How to access:** [Dashboard URL or tool access instructions] |
| 133 | |
| 134 | **What is measured:** |
| 135 | [ ] Core Web Vitals (LCP, INP, CLS) per page and journey |
| 136 | [ ] Custom performance marks for business-critical interactions |
| 137 | [ ] Resource timing for key assets |
| 138 | [ ] Long tasks (>50ms on main thread) |
| 139 | |
| 140 | ### Synthetic Monitoring |
| 141 | |
| 142 | **Tool:** [e.g. Lighthouse CI, WebPageTest, k6, Artillery, Playwright with performance assertions] |
| 143 | **Frequency:** [Every X minutes / on every deploy / nightly] |
| 144 | **Test location(s):** [e.g. eu-west-1, us-east-1] |
| 145 | **Device profile:** [Desktop 10Mbps / Mobile 4G Moto G4 / both] |
| 146 | |
| 147 | **Synthetic test suite location:** [Link to test files] |
| 148 | |
| 149 | ### Backend Observability |
| 150 | |
| 151 | **APM tool:** [e.g. Datadog, Grafana + Prometheus, New Relic, AWS X-Ray] |
| 152 | **Metrics collected:** |
| 153 | Request rate, error rate, duration (RED metrics) per endpoint |
| 154 | Database query duration and connection pool utilisation |
| 155 | Cache hit/miss rates |
| 156 | Background job queue depth and processing latency |
| 157 | |
| 158 | **Dashboard:** [Link to primary performance dashboard] |
| 159 | |
| 160 | |
| 161 | |
| 162 | ## CI/CD Performance Enforcement |
| 163 | |
| 164 | Performance budgets are enforced at two gates: |
| 165 | |
| 166 | ### Gate 1 — Build-time Bundle Analysis |
| 167 | |
| 168 | **Tool:** [e.g. bundlesize, size-limit, webpack-bundle-analyzer with CI assertion] |
| 169 | **Config file:** [`[.bundlesizerc / .size-limit.js / etc.]`] |
| 170 | **Trigger:** Every PR targeting `main` |
| 171 | **Blocking:** Yes — PR cannot merge if bundle size budget is exceeded |
| 172 | |
| 173 | |
| 174 | // Example .size-limit.js |
| 175 | [ |
| 176 | { |
| 177 | "path": "dist/js/*.js", |
| 178 | "limit": "200 KB" |
| 179 | }, |
| 180 | { |
| 181 | "path": "dist/css/*.css", |
| 182 | "limit": "50 KB" |
| 183 | } |
| 184 | ] |
| 185 | |
| 186 | |
| 187 | ### Gate 2 — Synthetic Performance Tests in CI |
| 188 | |
| 189 | **Tool:** [e.g. Lighthouse CI, k6, Artillery] |
| 190 | **Trigger:** On deploy to staging |
| 191 | **Blocking:** Yes — production deploy is blocked if thresholds fail |
| 192 | **Thresholds checked:** |
| 193 | LCP ≤ [Xs] |
| 194 | CLS ≤ [0.X] |
| 195 | P95 API latency ≤ [Xms] |
| 196 | Error rate < [X%] |
| 197 | |
| 198 | **CI config location:** [`[.github/workflows/perf.yml / ci/performance.yaml]`] |
| 199 | |
| 200 | **How to run locally:** |
| 201 | |
| 202 | # Run Lighthouse CI against local build |
| 203 | [command — e.g. lhci autorun --config=lighthouserc.js] |
| 204 | |
| 205 | # Run load test locally |
| 206 | [command — e.g. k6 run load-tests/api-smoke.js] |
| 207 | |
| 208 | |
| 209 | |
| 210 | |
| 211 | ## Budget Breach Response Process |
| 212 | |
| 213 | A budget breach is when a measured metric exceeds its target for [X consecutive measurements / X minutes sustained / a single deploy]. |
| 214 | |
| 215 | ### Breach Severity Levels |
| 216 | |
| 217 | | Severity | Condition | Response time | Who acts | |
| 218 | |---|---|---|---| |
| 219 | | P1 — Critical | >2× budget threshold in production | Immediate | On-call engineer + team lead | |
| 220 | | P2 — High | >1.5× budget threshold in production | Within 4 hours | On-call engineer | |
| 221 | | P3 — Medium | Threshold exceeded in production | Within 1 sprint | PR author + team | |
| 222 | | P4 — Low | Threshold exceeded in staging only | Before merge | PR author | |
| 223 | |
| 224 | ### Breach Investigation Checklist |
| 225 | |
| 226 | When a breach is detected, work through this checklist in order: |
| 227 | |
| 228 | **1. Identify the regression commit** |
| 229 | |
| 230 | # Compare performance across recent deploys |
| 231 | [command — e.g. datadog metrics query, lighthouse-ci compare, git bisect] |
| 232 | |
| 233 | |
| 234 | **2. Classify the breach** |
| 235 | [ ] Is this a code change? (new feature, refactor, dependency bump) |
| 236 | [ ] Is this an infrastructure change? (new instance type, config change) |
| 237 | [ ] Is this an external factor? (CDN issue, DNS, upstream dependency) |
| 238 | [ ] Is this a measurement anomaly? (test environment issue, sample size) |
| 239 | |
| 240 | **3. Immediate actions** |
| 241 | If P1/P2 in production and a code cause is confirmed: roll back or disable the feature flag |
| 242 | If cause is unknown: do not roll back immediately — gather more data first |
| 243 | Notify [#performance / #incidents Slack channel] with: metric name, current value, budget target, suspected cause |
| 244 | |
| 245 | **4. Resolution** |
| 246 | Fix the root cause — do not just adjust the budget threshold |
| 247 | Budget thresholds should only change after a team discussion and explicit approval from [tech lead / EM] |
| 248 | Document the breach in the [performance log / incident record] |
| 249 | |
| 250 | **Budget change policy:** Budget thresholds may only be relaxed if: (a) the feature delivering the regression has measurable business value that outweighs the performance cost, and (b) the change is reviewed and approved by [tech lead]. |
| 251 | |
| 252 | |
| 253 | |
| 254 | ## Performance Review Cadence |
| 255 | |
| 256 | | Trigger | Action | |
| 257 | |---|---| |
| 258 | | Every sprint | Review P95/P99 latency trends; flag any creeping degradation | |
| 259 | | Every quarter | Full performance budget review — update baselines, adjust targets, audit tooling | |
| 260 | | After major feature launch | Re-measure all Core Web Vitals and API SLOs; update baselines | |
| 261 | | After infrastructure change | Re-run full synthetic test suite; confirm no regression | |
| 262 | | After dependency upgrade | Run bundle size diff; confirm no unexpected size increase | |
| 263 | |
| 264 | **Next scheduled review:** [Date] |
| 265 | **Review owner:** [Name / role] |
| 266 | |
| 267 | |
| 268 | |
| 269 | ## Quality Checks |
| 270 | |
| 271 | [ ] Every budget threshold is a specific number — not a range or "TBD" |
| 272 | [ ] Both frontend (if applicable) and backend targets are defined — not just one or the other |
| 273 | [ ] Measurement tooling is named with a link to the dashboard or config file |
| 274 | [ ] CI enforcement is configured for at least one gate (build-time or deploy-time) |
| 275 | [ ] Budget breach response process names specific Slack channels and owners |
| 276 | [ ] Budget thresholds are anchored to baseline measurements or a justified target — not pulled from thin air |
| 277 | [ ] Per-journey targets are defined for critical user journeys, not just global averages |
| 278 | |
| 279 | ## Anti-Patterns |
| 280 | |
| 281 | [ ] Do not set budget thresholds without measuring a current baseline first — targets must be anchored to reality |
| 282 | [ ] Do not define global averages only — critical user journeys need individual budgets as they may diverge significantly |
| 283 | [ ] Do not omit CI enforcement — a performance budget that is not enforced in the build pipeline will not be respected |
| 284 | [ ] Do not leave the breach response process without named owners and escalation channels |
| 285 | [ ] Do not set budgets that apply only to one environment — production and staging targets should be documented separately if they differ |
| 286 |
Discussion
Browse more free Claude skills or everything in Development.