Load Testing Plan Skill
Write a load and performance testing plan for a service.
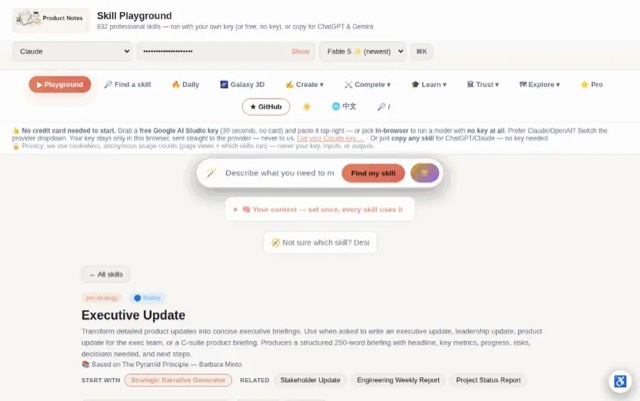
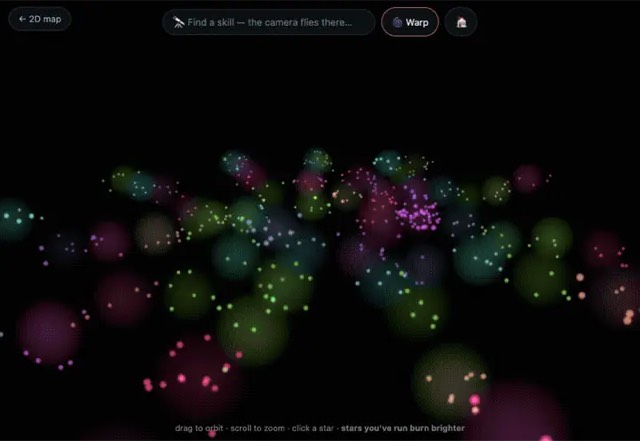
From the mohitagw15856/pm-claude-skills README — shows the whole collection, not only this skill. · view on GitHub
How to use it
Claude Code
- Run the line below. It pulls the whole folder into
~/.claude/skills/load-testing-plan, including the files SKILL.md points to. - Describe your job in plain words. Claude Code follows the skill from there.
npx degit mohitagw15856/pm-claude-skills/skills/load-testing-plan#main ~/.claude/skills/load-testing-planFor one project only, change the path to .claude/skills/load-testing-plan. This skill also uses loginRes.json, response.json, locustfile.py, results.json — copying SKILL.md alone won't be enough. See the folder on GitHub.
Claude (web or desktop app)
- On this page open ⋯ → Download .md.
- Save it as SKILL.md in a folder, zip the folder, then Customize → Skills → + → Create skill → Upload a skill.
- Pick the file and Save. Claude shows the name and description and runs a security scan.
- Check the skill is switched on.
- Start a new chat and describe your job in plain words. The AI follows the skill from there.
ChatGPT or another app
- ChatGPT: make a Project and paste it into Instructions.
- Neither? Paste it at the top of a new chat — it works for that chat.
Not working?
- Check which app you pasted it into — the steps above name the right one.
- Some skills need the paid tier of Claude or ChatGPT.
Paste into Claude, ChatGPT or Cursor.
Source of Load Testing Plan Skill
Show the full text441 lines
| name | description |
|---|---|
| load-testing-plan | Write a load and performance testing plan for a service. Use when asked to create a performance test plan, write load testing documentation, define stress or soak test scenarios, or set performance regression gates for CI. Produces a complete test plan document with scenario definitions, k6/Locust script skeleton, threshold table, result interpretation guide, and CI integration steps. |
Load Testing Plan Skill
Produce a complete load and performance testing plan for a service — covering test objectives, scenario definitions, tooling configuration, success thresholds, and CI integration. A good load testing plan eliminates ambiguity about what "performance is acceptable" means, so engineers can run tests and get a pass/fail answer without having to interpret raw numbers themselves.
Required Inputs
Ask for these if not already provided:
- Service name and key endpoints — which endpoints are under test (path, method, typical request/response shape)
- Current traffic baseline — current requests/sec, p50/p99 latency, error rate under normal load
- Peak traffic expectations — expected peak RPS (e.g. 10× baseline for flash sales, or seasonality peak)
- SLO targets — latency SLOs (p99 < X ms), error rate SLO (< Y%), availability target
- Preferred testing tool — k6, Locust, JMeter, Gatling, or no preference
- Test environment availability — dedicated load test environment, staging, or production (with traffic shaping)
Output Format
Load Testing Plan: [Service Name]
Author: [Name] | Team: [Team name] Date: [Date] | Review cycle: Before each major release and quarterly Testing tool: [k6 / Locust / JMeter / Gatling] Test environment: [Environment name and URL]
1. Objectives and Scope
What we are testing: [Service name] handles [describe function — e.g. "user authentication requests from the mobile and web clients"]. This plan validates that the service meets its SLOs under expected and elevated traffic conditions.
In scope:
- [Endpoint 1: METHOD /path — description]
- [Endpoint 2: METHOD /path — description]
- [Endpoint 3: METHOD /path — description]
Out of scope:
- [Any endpoints explicitly excluded and why — e.g. "admin APIs — low traffic, excluded from load test"]
- [Third-party integrations that cannot be load-tested — mock them instead]
2. Performance Targets (Success Criteria)
Every scenario has explicit pass/fail thresholds. A test run FAILS if any threshold is breached.
| Metric | Baseline scenario | Stress scenario | Spike scenario | Soak scenario |
|---|---|---|---|---|
| p50 latency | < [X] ms | < [X × 1.5] ms | < [X × 2] ms | < [X] ms |
| p95 latency | < [Y] ms | < [Y × 1.5] ms | < [Y × 2] ms | < [Y] ms |
| p99 latency | < [Z] ms | < [Z × 2] ms | < [Z × 3] ms | < [Z] ms |
| Error rate | < [0.1]% | < [1]% | < [2]% | < [0.1]% |
| Throughput | ≥ [N] RPS | ≥ [N × 3] RPS | N/A | ≥ [N] RPS |
| Failed requests | 0 (5xx) | < [threshold] | < [threshold] | 0 (5xx) |
SLO reference: These thresholds are derived from the service SLOs — p99 < [Z ms], error rate < [0.1]%, availability [99.9]%.
3. Traffic Model
Baseline traffic (current production):
- Average RPS: [N] req/sec
- Peak RPS (observed): [N] req/sec
- Request distribution by endpoint:
- [Endpoint 1]: [X]% of traffic
- [Endpoint 2]: [Y]% of traffic
- [Endpoint 3]: [Z]% of traffic
Simulated user behaviour:
- Think time between requests: [X–Y] seconds (randomised)
- Session duration: [N] minutes average
- Authenticated vs anonymous ratio: [X]%/[Y]%
- Geographic distribution: [Region 1 X]%, [Region 2 Y]%
4. Test Scenarios
Scenario 1: Baseline (Steady-State)
Purpose: Confirm the service performs acceptably under normal production load. Duration: 10 minutes Load profile: Ramp to [N] RPS over 2 minutes, hold for 8 minutes. Concurrency: [N] virtual users
Pass criteria: All thresholds in the Baseline column of the targets table above.
Scenario 2: Stress Test
Purpose: Find the breaking point — how much load can the service handle before SLOs are breached? Duration: 20–30 minutes Load profile: Ramp from [N] RPS (baseline) to [N × 5] RPS in 5-minute steps. Hold each step for 5 minutes. Stop at first SLO breach. Concurrency: Scales with RPS target
What to record:
- RPS at which p99 latency first exceeds SLO
- RPS at which error rate first exceeds SLO
- Whether the service recovers when load drops back to baseline
Scenario 3: Spike Test
Purpose: Simulate a sudden traffic surge (flash sale, viral event, bot attack). Duration: 15 minutes Load profile: Hold at [N] RPS (baseline) for 3 minutes, spike to [N × 10] RPS instantly, hold for 5 minutes, drop back to baseline for 7 minutes.
What to record:
- Latency during spike and recovery
- Whether the service sheds load gracefully (rate limiting, queue depth)
- Time to recover to baseline latency after spike ends
Scenario 4: Soak / Endurance Test
Purpose: Detect memory leaks, connection pool exhaustion, and slow degradation over time. Duration: 4–8 hours (run overnight) Load profile: Steady [N × 1.5] RPS (50% above baseline) for entire duration.
What to watch:
- Memory usage trend over time (should not grow unboundedly)
- Error rate trend (should be flat, not creeping up)
- GC pause frequency (JVM/Go services)
- Database connection pool utilisation
- p99 latency trend (should not creep up over hours)
5. Test Environment Requirements
Infrastructure
| Component | Requirement | Notes |
|---|---|---|
| Service under test | Isolated from production | [N] replicas, matching prod resource limits |
| Database | Separate instance with production-scale data | Seed script in section 7 |
| Cache (Redis/Memcached) | Empty at test start | Ensures cold-start conditions are tested |
| Load generator | Separate from service under test | [N] vCPUs, [N] GB RAM minimum |
| Network | Low-latency path to service | Do not run generator on same host |
Data Seeding
Before every test run, ensure the environment has:
# Seed test users (needed for authenticated endpoint tests)
[seed command or script path — e.g. python scripts/seed_load_test_users.py --count 10000]

# Seed test data for read endpoints
[seed command — e.g. ./scripts/seed_products.sh --count 50000]

# Verify seed completed
[verification command — e.g. psql $DB_URL -c "SELECT COUNT(*) FROM users WHERE load_test=true"]
Test data rules:
- Never use real production user data in load tests
- Tag all test-generated records with
load_test=truefor easy cleanup - Run cleanup after each test:
[cleanup command]
6. Tooling Setup
k6 Script Skeleton
import http from 'k6/http';
import { check, sleep } from 'k6';
import { Rate, Trend } from 'k6/metrics';

// Custom metrics
const errorRate = new Rate('error_rate');
const endpointLatency = new Trend('endpoint_latency', true);

// Test configuration — override per scenario
export const options = {
  scenarios: {
    baseline: {
      executor: 'ramping-vus',
      startVUs: 0,
      stages: [
        { duration: '2m', target: [BASELINE_VUS] },
        { duration: '8m', target: [BASELINE_VUS] },
        { duration: '1m', target: 0 },
      ],
    },
  },
  thresholds: {
    http_req_duration: [
      'p(95)<[Y_MS]',
      'p(99)<[Z_MS]',
    ],
    error_rate: ['rate<0.01'],
    http_req_failed: ['rate<0.01'],
  },
};

// Auth helper — get token once per VU
export function setup() {
  const loginRes = http.post('[BASE_URL]/auth/login', JSON.stringify({
    username: `load_test_user_${Math.floor(Math.random() * 10000)}@example.com`,
    password: __ENV.LOAD_TEST_PASSWORD,
  }), { headers: { 'Content-Type': 'application/json' } });

  check(loginRes, { 'login ok': (r) => r.status === 200 });
  return { token: loginRes.json('access_token') };
}

export default function (data) {
  const headers = {
    Authorization: `Bearer ${data.token}`,
    'Content-Type': 'application/json',
  };

  // Endpoint 1: [Description]
  const res1 = http.get('[BASE_URL]/[endpoint-1]', { headers });
  check(res1, {
    '[endpoint-1] status 200': (r) => r.status === 200,
    '[endpoint-1] latency < [X]ms': (r) => r.timings.duration < [X],
  });
  errorRate.add(res1.status >= 400);
  endpointLatency.add(res1.timings.duration, { endpoint: '[endpoint-1]' });

  sleep(Math.random() * [THINK_TIME_MAX] + [THINK_TIME_MIN]);

  // Endpoint 2: [Description]
  const res2 = http.post('[BASE_URL]/[endpoint-2]',
    JSON.stringify({ [key]: '[value]' }),
    { headers }
  );
  check(res2, {
    '[endpoint-2] status 201': (r) => r.status === 201,
  });
  errorRate.add(res2.status >= 400);
}
Locust Script Skeleton (alternative)
from locust import HttpUser, task, between
import random

class [ServiceName]User(HttpUser):
    wait_time = between([THINK_TIME_MIN], [THINK_TIME_MAX])
    token = None

    def on_start(self):
        """Called once per simulated user — authenticate."""
        user_id = random.randint(1, 10000)
        response = self.client.post("/auth/login", json={
            "username": f"load_test_user_{user_id}@example.com",
            "password": "[LOAD_TEST_PASSWORD]",
        })
        self.token = response.json()["access_token"]
        self.headers = {"Authorization": f"Bearer {self.token}"}

    @task([WEIGHT_1])  # Weight = relative frequency
    def [endpoint_1_task](self):
        """[Endpoint 1 description]"""
        with self.client.get(
            "/[endpoint-1]",
            headers=self.headers,
            catch_response=True
        ) as response:
            if response.elapsed.total_seconds() > [LATENCY_THRESHOLD]:
                response.failure(f"Too slow: {response.elapsed.total_seconds()}s")

    @task([WEIGHT_2])
    def [endpoint_2_task](self):
        """[Endpoint 2 description]"""
        self.client.post(
            "/[endpoint-2]",
            json={"[key]": "[value]"},
            headers=self.headers,
        )
Running Tests
# k6 — run baseline scenario
k6 run --env BASE_URL=https://[test-env-url] scripts/load_test.js

# k6 — run stress scenario with output to InfluxDB
k6 run --out influxdb=http://[influxdb-host]:8086/k6 \
  --env SCENARIO=stress \
  scripts/load_test.js

# Locust — headless run
locust -f locustfile.py \
  --headless \
  --users [N] \
  --spawn-rate [N] \
  --run-time 10m \
  --host https://[test-env-url] \
  --csv=results/[run-id]

# Locust — web UI (interactive)
locust -f locustfile.py --host https://[test-env-url]
7. Metrics to Capture
Capture all of the following during every test run. Missing any of these makes result comparison unreliable.
| Metric | Source | Why it matters |
|---|---|---|
| p50, p95, p99, p999 latency per endpoint | Load tool | SLO validation |
| Error rate (4xx, 5xx) per endpoint | Load tool | SLO validation |
| Requests/sec (throughput) | Load tool | Capacity baseline |
| CPU utilisation (%) | Infra monitoring | Saturation signal |
| Memory utilisation (%) | Infra monitoring | Leak detection |
| GC pause time / frequency | JVM/Go metrics | Latency spike root cause |
| DB connection pool: active/idle/waiting | DB metrics | Pool exhaustion detection |
| DB query latency (p99) | DB metrics | Downstream bottleneck |
| Cache hit rate | Cache metrics | Miss storm detection |
| Pod/instance count (if autoscaling) | Infra | Scaling behaviour |
| Network in/out bytes | Infra | Bandwidth saturation |
8. Result Analysis Framework
After each test run, work through this analysis in order:
Step 1 — Pass/fail check Compare all captured metrics against the thresholds in Section 2. Record pass/fail per scenario.
Step 2 — Latency distribution Plot the full latency histogram, not just percentiles. A bimodal distribution (two humps) indicates two distinct code paths — investigate the slow hump.
Step 3 — Error correlation If errors occurred, correlate them with:
- Time of occurrence (was it during ramp-up, steady state, or spike?)
- Specific endpoint (is it one endpoint or all?)
- Infrastructure events (CPU spike, OOM, DB connection exhaustion?)
Step 4 — Saturation analysis Graph CPU, memory, and connection pool over time. If any resource reached 80%+ of capacity, it is a candidate bottleneck — even if SLOs passed this run.
Step 5 — Compare to baseline run Every run should be compared to the previous run. A 10% regression in p99 latency warrants investigation even if it is still within SLO.
Regression classification:
| Change | Classification | Action |
|---|---|---|
| p99 within 5% of previous run | Green — no regression | No action |
| p99 5–15% worse than previous | Yellow — watch | Investigate before next release |
| p99 >15% worse than previous | Red — regression | Block release, file ticket |
| Error rate increased vs previous | Red — regression | Block release |
| SLO threshold breached | Critical | Block release, page on-call |
9. CI Integration
Add load tests as a gated step in the release pipeline. Run the baseline scenario on every release candidate; run all scenarios weekly.
# Example: GitHub Actions step (adapt for your CI platform)
load-test:
  runs-on: ubuntu-latest
  needs: [deploy-staging]
  if: github.ref == 'refs/heads/main'
  steps:
    - uses: actions/checkout@v3

    - name: Install k6
      run: |
        curl -s https://dl.k6.io/key.gpg | sudo apt-key add -
        echo "deb https://dl.k6.io/deb stable main" | sudo tee /etc/apt/sources.list.d/k6.list
        sudo apt-get update && sudo apt-get install k6

    - name: Seed test data
      run: [seed command]

    - name: Run baseline load test
      run: |
        k6 run \
          --env BASE_URL=${{ secrets.LOAD_TEST_ENV_URL }} \
          --out json=results.json \
          scripts/load_test.js
      env:
        LOAD_TEST_ENV_URL: ${{ secrets.LOAD_TEST_ENV_URL }}

    - name: Check thresholds
      run: |
        # k6 exits with non-zero if any threshold fails — this step fails the build
        echo "k6 threshold check complete"

    - name: Upload results
      uses: actions/upload-artifact@v3
      if: always()
      with:
        name: load-test-results-${{ github.run_id }}
        path: results.json

    - name: Cleanup test data
      if: always()
      run: [cleanup command]
CI gates summary:
- Baseline scenario runs on every release to staging
- Full scenario suite (stress, spike, soak) runs weekly on a schedule
- Any threshold failure blocks promotion to production
- Results are archived for trend analysis
Quality Checks
- All key endpoints are covered by at least one test scenario — no production endpoint is untested
- Thresholds are derived from actual SLO targets, not guesses
- Test data seeding is scripted and reproducible — tests do not rely on pre-existing environment state
- The load generator runs on separate infrastructure from the service under test
- CI integration blocks promotion on threshold failure — not just records results
- Soak test has been run at least once to establish a memory and connection pool baseline
- Results comparison to previous run is part of the analysis — not just absolute pass/fail
Anti-Patterns
- Do not set thresholds without grounding them in actual SLO targets or production baselines — arbitrary numbers produce meaningless pass/fail results
- Do not run the load generator on the same host as the service under test — this contaminates both the test results and the service metrics
- Do not use production user data in load test seeding — all test data must be synthetic, tagged, and cleaned up after each run
- Do not skip the soak test on first deployment — only a soak test reveals slow memory leaks and connection pool exhaustion that short tests miss
- Do not treat a passing baseline test as evidence the service handles spikes — baseline, stress, spike, and soak scenarios test fundamentally different failure modes
| 1 | |
| 2 | name load-testing-plan |
| 3 | description "Write a load and performance testing plan for a service. Use when asked to create a performance test plan, write load testing documentation, define stress or soak test scenarios, or set performance regression gates for CI. Produces a complete test plan document with scenario definitions, k6/Locust script skeleton, threshold table, result interpretation guide, and CI integration steps." |
| 4 | |
| 5 | |
| 6 | # Load Testing Plan Skill |
| 7 | |
| 8 | Produce a complete load and performance testing plan for a service — covering test objectives, scenario definitions, tooling configuration, success thresholds, and CI integration. A good load testing plan eliminates ambiguity about what "performance is acceptable" means, so engineers can run tests and get a pass/fail answer without having to interpret raw numbers themselves. |
| 9 | |
| 10 | ## Required Inputs |
| 11 | |
| 12 | Ask for these if not already provided: |
| 13 | **Service name and key endpoints** — which endpoints are under test (path, method, typical request/response shape) |
| 14 | **Current traffic baseline** — current requests/sec, p50/p99 latency, error rate under normal load |
| 15 | **Peak traffic expectations** — expected peak RPS (e.g. 10× baseline for flash sales, or seasonality peak) |
| 16 | **SLO targets** — latency SLOs (p99 < X ms), error rate SLO (< Y%), availability target |
| 17 | **Preferred testing tool** — k6, Locust, JMeter, Gatling, or no preference |
| 18 | **Test environment availability** — dedicated load test environment, staging, or production (with traffic shaping) |
| 19 | |
| 20 | ## Output Format |
| 21 | |
| 22 | |
| 23 | |
| 24 | # Load Testing Plan: [Service Name] |
| 25 | |
| 26 | **Author:** [Name] | **Team:** [Team name] |
| 27 | **Date:** [Date] | **Review cycle:** Before each major release and quarterly |
| 28 | **Testing tool:** [k6 / Locust / JMeter / Gatling] |
| 29 | **Test environment:** [Environment name and URL] |
| 30 | |
| 31 | |
| 32 | |
| 33 | ## 1. Objectives and Scope |
| 34 | |
| 35 | **What we are testing:** [Service name] handles [describe function — e.g. "user authentication requests from the mobile and web clients"]. This plan validates that the service meets its SLOs under expected and elevated traffic conditions. |
| 36 | |
| 37 | **In scope:** |
| 38 | [Endpoint 1: METHOD /path — description] |
| 39 | [Endpoint 2: METHOD /path — description] |
| 40 | [Endpoint 3: METHOD /path — description] |
| 41 | |
| 42 | **Out of scope:** |
| 43 | [Any endpoints explicitly excluded and why — e.g. "admin APIs — low traffic, excluded from load test"] |
| 44 | [Third-party integrations that cannot be load-tested — mock them instead] |
| 45 | |
| 46 | |
| 47 | |
| 48 | ## 2. Performance Targets (Success Criteria) |
| 49 | |
| 50 | Every scenario has explicit pass/fail thresholds. A test run FAILS if any threshold is breached. |
| 51 | |
| 52 | | Metric | Baseline scenario | Stress scenario | Spike scenario | Soak scenario | |
| 53 | |---|---|---|---|---| |
| 54 | | p50 latency | < [X] ms | < [X × 1.5] ms | < [X × 2] ms | < [X] ms | |
| 55 | | p95 latency | < [Y] ms | < [Y × 1.5] ms | < [Y × 2] ms | < [Y] ms | |
| 56 | | p99 latency | < [Z] ms | < [Z × 2] ms | < [Z × 3] ms | < [Z] ms | |
| 57 | | Error rate | < [0.1]% | < [1]% | < [2]% | < [0.1]% | |
| 58 | | Throughput | ≥ [N] RPS | ≥ [N × 3] RPS | N/A | ≥ [N] RPS | |
| 59 | | Failed requests | 0 (5xx) | < [threshold] | < [threshold] | 0 (5xx) | |
| 60 | |
| 61 | **SLO reference:** These thresholds are derived from the service SLOs — p99 < [Z ms], error rate < [0.1]%, availability [99.9]%. |
| 62 | |
| 63 | |
| 64 | |
| 65 | ## 3. Traffic Model |
| 66 | |
| 67 | **Baseline traffic (current production):** |
| 68 | Average RPS: [N] req/sec |
| 69 | Peak RPS (observed): [N] req/sec |
| 70 | Request distribution by endpoint: |
| 71 | [Endpoint 1]: [X]% of traffic |
| 72 | [Endpoint 2]: [Y]% of traffic |
| 73 | [Endpoint 3]: [Z]% of traffic |
| 74 | |
| 75 | **Simulated user behaviour:** |
| 76 | Think time between requests: [X–Y] seconds (randomised) |
| 77 | Session duration: [N] minutes average |
| 78 | Authenticated vs anonymous ratio: [X]%/[Y]% |
| 79 | Geographic distribution: [Region 1 X]%, [Region 2 Y]% |
| 80 | |
| 81 | |
| 82 | |
| 83 | ## 4. Test Scenarios |
| 84 | |
| 85 | ### Scenario 1: Baseline (Steady-State) |
| 86 | |
| 87 | **Purpose:** Confirm the service performs acceptably under normal production load. |
| 88 | **Duration:** 10 minutes |
| 89 | **Load profile:** Ramp to [N] RPS over 2 minutes, hold for 8 minutes. |
| 90 | **Concurrency:** [N] virtual users |
| 91 | |
| 92 | **Pass criteria:** All thresholds in the Baseline column of the targets table above. |
| 93 | |
| 94 | |
| 95 | |
| 96 | ### Scenario 2: Stress Test |
| 97 | |
| 98 | **Purpose:** Find the breaking point — how much load can the service handle before SLOs are breached? |
| 99 | **Duration:** 20–30 minutes |
| 100 | **Load profile:** Ramp from [N] RPS (baseline) to [N × 5] RPS in 5-minute steps. Hold each step for 5 minutes. Stop at first SLO breach. |
| 101 | **Concurrency:** Scales with RPS target |
| 102 | |
| 103 | **What to record:** |
| 104 | RPS at which p99 latency first exceeds SLO |
| 105 | RPS at which error rate first exceeds SLO |
| 106 | Whether the service recovers when load drops back to baseline |
| 107 | |
| 108 | |
| 109 | |
| 110 | ### Scenario 3: Spike Test |
| 111 | |
| 112 | **Purpose:** Simulate a sudden traffic surge (flash sale, viral event, bot attack). |
| 113 | **Duration:** 15 minutes |
| 114 | **Load profile:** Hold at [N] RPS (baseline) for 3 minutes, spike to [N × 10] RPS instantly, hold for 5 minutes, drop back to baseline for 7 minutes. |
| 115 | |
| 116 | **What to record:** |
| 117 | Latency during spike and recovery |
| 118 | Whether the service sheds load gracefully (rate limiting, queue depth) |
| 119 | Time to recover to baseline latency after spike ends |
| 120 | |
| 121 | |
| 122 | |
| 123 | ### Scenario 4: Soak / Endurance Test |
| 124 | |
| 125 | **Purpose:** Detect memory leaks, connection pool exhaustion, and slow degradation over time. |
| 126 | **Duration:** 4–8 hours (run overnight) |
| 127 | **Load profile:** Steady [N × 1.5] RPS (50% above baseline) for entire duration. |
| 128 | |
| 129 | **What to watch:** |
| 130 | Memory usage trend over time (should not grow unboundedly) |
| 131 | Error rate trend (should be flat, not creeping up) |
| 132 | GC pause frequency (JVM/Go services) |
| 133 | Database connection pool utilisation |
| 134 | p99 latency trend (should not creep up over hours) |
| 135 | |
| 136 | |
| 137 | |
| 138 | ## 5. Test Environment Requirements |
| 139 | |
| 140 | ### Infrastructure |
| 141 | |
| 142 | | Component | Requirement | Notes | |
| 143 | |---|---|---| |
| 144 | | Service under test | Isolated from production | [N] replicas, matching prod resource limits | |
| 145 | | Database | Separate instance with production-scale data | Seed script in section 7 | |
| 146 | | Cache (Redis/Memcached) | Empty at test start | Ensures cold-start conditions are tested | |
| 147 | | Load generator | Separate from service under test | [N] vCPUs, [N] GB RAM minimum | |
| 148 | | Network | Low-latency path to service | Do not run generator on same host | |
| 149 | |
| 150 | ### Data Seeding |
| 151 | |
| 152 | Before every test run, ensure the environment has: |
| 153 | |
| 154 | # Seed test users (needed for authenticated endpoint tests) |
| 155 | [seed command or script path — e.g. python scripts/seed_load_test_users.py --count 10000] |
| 156 | |
| 157 | # Seed test data for read endpoints |
| 158 | [seed command — e.g. ./scripts/seed_products.sh --count 50000] |
| 159 | |
| 160 | # Verify seed completed |
| 161 | [verification command — e.g. psql $DB_URL -c "SELECT COUNT(*) FROM users WHERE load_test=true"] |
| 162 | |
| 163 | |
| 164 | **Test data rules:** |
| 165 | Never use real production user data in load tests |
| 166 | Tag all test-generated records with `load_test=true` for easy cleanup |
| 167 | Run cleanup after each test: `[cleanup command]` |
| 168 | |
| 169 | |
| 170 | |
| 171 | ## 6. Tooling Setup |
| 172 | |
| 173 | ### k6 Script Skeleton |
| 174 | |
| 175 | |
| 176 | import http from 'k6/http'; |
| 177 | import { check, sleep } from 'k6'; |
| 178 | import { Rate, Trend } from 'k6/metrics'; |
| 179 | |
| 180 | // Custom metrics |
| 181 | const errorRate = new Rate('error_rate'); |
| 182 | const endpointLatency = new Trend('endpoint_latency', true); |
| 183 | |
| 184 | // Test configuration — override per scenario |
| 185 | export const options = { |
| 186 | scenarios: { |
| 187 | baseline: { |
| 188 | executor: 'ramping-vus', |
| 189 | startVUs: 0, |
| 190 | stages: [ |
| 191 | { duration: '2m', target: [BASELINE_VUS] }, |
| 192 | { duration: '8m', target: [BASELINE_VUS] }, |
| 193 | { duration: '1m', target: 0 }, |
| 194 | ], |
| 195 | }, |
| 196 | }, |
| 197 | thresholds: { |
| 198 | http_req_duration: [ |
| 199 | 'p(95)<[Y_MS]', |
| 200 | 'p(99)<[Z_MS]', |
| 201 | ], |
| 202 | error_rate: ['rate<0.01'], |
| 203 | http_req_failed: ['rate<0.01'], |
| 204 | }, |
| 205 | }; |
| 206 | |
| 207 | // Auth helper — get token once per VU |
| 208 | export function setup() { |
| 209 | const loginRes = http.post('[BASE_URL]/auth/login', JSON.stringify({ |
| 210 | username: `load_test_user_${Math.floor(Math.random() * 10000)}@example.com`, |
| 211 | password: __ENV.LOAD_TEST_PASSWORD, |
| 212 | }), { headers: { 'Content-Type': 'application/json' } }); |
| 213 | |
| 214 | check(loginRes, { 'login ok': (r) => r.status === 200 }); |
| 215 | return { token: loginRes.json('access_token') }; |
| 216 | } |
| 217 | |
| 218 | export default function (data) { |
| 219 | const headers = { |
| 220 | Authorization: `Bearer ${data.token}`, |
| 221 | 'Content-Type': 'application/json', |
| 222 | }; |
| 223 | |
| 224 | // Endpoint 1: [Description] |
| 225 | const res1 = http.get('[BASE_URL]/[endpoint-1]', { headers }); |
| 226 | check(res1, { |
| 227 | '[endpoint-1] status 200': (r) => r.status === 200, |
| 228 | '[endpoint-1] latency < [X]ms': (r) => r.timings.duration < [X], |
| 229 | }); |
| 230 | errorRate.add(res1.status >= 400); |
| 231 | endpointLatency.add(res1.timings.duration, { endpoint: '[endpoint-1]' }); |
| 232 | |
| 233 | sleep(Math.random() * [THINK_TIME_MAX] + [THINK_TIME_MIN]); |
| 234 | |
| 235 | // Endpoint 2: [Description] |
| 236 | const res2 = http.post('[BASE_URL]/[endpoint-2]', |
| 237 | JSON.stringify({ [key]: '[value]' }), |
| 238 | { headers } |
| 239 | ); |
| 240 | check(res2, { |
| 241 | '[endpoint-2] status 201': (r) => r.status === 201, |
| 242 | }); |
| 243 | errorRate.add(res2.status >= 400); |
| 244 | } |
| 245 | |
| 246 | |
| 247 | ### Locust Script Skeleton (alternative) |
| 248 | |
| 249 | |
| 250 | from locust import HttpUser, task, between |
| 251 | import random |
| 252 | |
| 253 | class [ServiceName]User(HttpUser): |
| 254 | wait_time = between([THINK_TIME_MIN], [THINK_TIME_MAX]) |
| 255 | token = None |
| 256 | |
| 257 | def on_start(self): |
| 258 | """Called once per simulated user — authenticate.""" |
| 259 | user_id = random.randint(1, 10000) |
| 260 | response = self.client.post("/auth/login", json={ |
| 261 | "username": f"load_test_user_{user_id}@example.com", |
| 262 | "password": "[LOAD_TEST_PASSWORD]", |
| 263 | }) |
| 264 | self.token = response.json()["access_token"] |
| 265 | self.headers = {"Authorization": f"Bearer {self.token}"} |
| 266 | |
| 267 | @task([WEIGHT_1]) # Weight = relative frequency |
| 268 | def [endpoint_1_task](self): |
| 269 | """[Endpoint 1 description]""" |
| 270 | with self.client.get( |
| 271 | "/[endpoint-1]", |
| 272 | headers=self.headers, |
| 273 | catch_response=True |
| 274 | ) as response: |
| 275 | if response.elapsed.total_seconds() > [LATENCY_THRESHOLD]: |
| 276 | response.failure(f"Too slow: {response.elapsed.total_seconds()}s") |
| 277 | |
| 278 | @task([WEIGHT_2]) |
| 279 | def [endpoint_2_task](self): |
| 280 | """[Endpoint 2 description]""" |
| 281 | self.client.post( |
| 282 | "/[endpoint-2]", |
| 283 | json={"[key]": "[value]"}, |
| 284 | headers=self.headers, |
| 285 | ) |
| 286 | |
| 287 | |
| 288 | ### Running Tests |
| 289 | |
| 290 | |
| 291 | # k6 — run baseline scenario |
| 292 | k6 run --env BASE_URL=https://[test-env-url] scripts/load_test.js |
| 293 | |
| 294 | # k6 — run stress scenario with output to InfluxDB |
| 295 | k6 run --out influxdb=http://[influxdb-host]:8086/k6 \ |
| 296 | --env SCENARIO=stress \ |
| 297 | scripts/load_test.js |
| 298 | |
| 299 | # Locust — headless run |
| 300 | locust -f locustfile.py \ |
| 301 | --headless \ |
| 302 | --users [N] \ |
| 303 | --spawn-rate [N] \ |
| 304 | --run-time 10m \ |
| 305 | --host https://[test-env-url] \ |
| 306 | --csv=results/[run-id] |
| 307 | |
| 308 | # Locust — web UI (interactive) |
| 309 | locust -f locustfile.py --host https://[test-env-url] |
| 310 | |
| 311 | |
| 312 | |
| 313 | |
| 314 | ## 7. Metrics to Capture |
| 315 | |
| 316 | Capture all of the following during every test run. Missing any of these makes result comparison unreliable. |
| 317 | |
| 318 | | Metric | Source | Why it matters | |
| 319 | |---|---|---| |
| 320 | | p50, p95, p99, p999 latency per endpoint | Load tool | SLO validation | |
| 321 | | Error rate (4xx, 5xx) per endpoint | Load tool | SLO validation | |
| 322 | | Requests/sec (throughput) | Load tool | Capacity baseline | |
| 323 | | CPU utilisation (%) | Infra monitoring | Saturation signal | |
| 324 | | Memory utilisation (%) | Infra monitoring | Leak detection | |
| 325 | | GC pause time / frequency | JVM/Go metrics | Latency spike root cause | |
| 326 | | DB connection pool: active/idle/waiting | DB metrics | Pool exhaustion detection | |
| 327 | | DB query latency (p99) | DB metrics | Downstream bottleneck | |
| 328 | | Cache hit rate | Cache metrics | Miss storm detection | |
| 329 | | Pod/instance count (if autoscaling) | Infra | Scaling behaviour | |
| 330 | | Network in/out bytes | Infra | Bandwidth saturation | |
| 331 | |
| 332 | |
| 333 | |
| 334 | ## 8. Result Analysis Framework |
| 335 | |
| 336 | After each test run, work through this analysis in order: |
| 337 | |
| 338 | **Step 1 — Pass/fail check** |
| 339 | Compare all captured metrics against the thresholds in Section 2. Record pass/fail per scenario. |
| 340 | |
| 341 | **Step 2 — Latency distribution** |
| 342 | Plot the full latency histogram, not just percentiles. A bimodal distribution (two humps) indicates two distinct code paths — investigate the slow hump. |
| 343 | |
| 344 | **Step 3 — Error correlation** |
| 345 | If errors occurred, correlate them with: |
| 346 | Time of occurrence (was it during ramp-up, steady state, or spike?) |
| 347 | Specific endpoint (is it one endpoint or all?) |
| 348 | Infrastructure events (CPU spike, OOM, DB connection exhaustion?) |
| 349 | |
| 350 | **Step 4 — Saturation analysis** |
| 351 | Graph CPU, memory, and connection pool over time. If any resource reached 80%+ of capacity, it is a candidate bottleneck — even if SLOs passed this run. |
| 352 | |
| 353 | **Step 5 — Compare to baseline run** |
| 354 | Every run should be compared to the previous run. A 10% regression in p99 latency warrants investigation even if it is still within SLO. |
| 355 | |
| 356 | **Regression classification:** |
| 357 | |
| 358 | | Change | Classification | Action | |
| 359 | |---|---|---| |
| 360 | | p99 within 5% of previous run | Green — no regression | No action | |
| 361 | | p99 5–15% worse than previous | Yellow — watch | Investigate before next release | |
| 362 | | p99 >15% worse than previous | Red — regression | Block release, file ticket | |
| 363 | | Error rate increased vs previous | Red — regression | Block release | |
| 364 | | SLO threshold breached | Critical | Block release, page on-call | |
| 365 | |
| 366 | |
| 367 | |
| 368 | ## 9. CI Integration |
| 369 | |
| 370 | Add load tests as a gated step in the release pipeline. Run the baseline scenario on every release candidate; run all scenarios weekly. |
| 371 | |
| 372 | |
| 373 | # Example: GitHub Actions step (adapt for your CI platform) |
| 374 | load-test: |
| 375 | runs-on: ubuntu-latest |
| 376 | needs: [deploy-staging] |
| 377 | if: github.ref == 'refs/heads/main' |
| 378 | steps: |
| 379 | - uses: actions/checkout@v3 |
| 380 | |
| 381 | - name: Install k6 |
| 382 | run: | |
| 383 | curl -s https://dl.k6.io/key.gpg | sudo apt-key add - |
| 384 | echo "deb https://dl.k6.io/deb stable main" | sudo tee /etc/apt/sources.list.d/k6.list |
| 385 | sudo apt-get update && sudo apt-get install k6 |
| 386 | |
| 387 | - name: Seed test data |
| 388 | run: [seed command] |
| 389 | |
| 390 | - name: Run baseline load test |
| 391 | run: | |
| 392 | k6 run \ |
| 393 | --env BASE_URL=${{ secrets.LOAD_TEST_ENV_URL }} \ |
| 394 | --out json=results.json \ |
| 395 | scripts/load_test.js |
| 396 | env: |
| 397 | LOAD_TEST_ENV_URL: ${{ secrets.LOAD_TEST_ENV_URL }} |
| 398 | |
| 399 | - name: Check thresholds |
| 400 | run: | |
| 401 | # k6 exits with non-zero if any threshold fails — this step fails the build |
| 402 | echo "k6 threshold check complete" |
| 403 | |
| 404 | - name: Upload results |
| 405 | uses: actions/upload-artifact@v3 |
| 406 | if: always() |
| 407 | with: |
| 408 | name: load-test-results-${{ github.run_id }} |
| 409 | path: results.json |
| 410 | |
| 411 | - name: Cleanup test data |
| 412 | if: always() |
| 413 | run: [cleanup command] |
| 414 | |
| 415 | |
| 416 | **CI gates summary:** |
| 417 | Baseline scenario runs on every release to staging |
| 418 | Full scenario suite (stress, spike, soak) runs weekly on a schedule |
| 419 | Any threshold failure blocks promotion to production |
| 420 | Results are archived for trend analysis |
| 421 | |
| 422 | |
| 423 | |
| 424 | ## Quality Checks |
| 425 | |
| 426 | [ ] All key endpoints are covered by at least one test scenario — no production endpoint is untested |
| 427 | [ ] Thresholds are derived from actual SLO targets, not guesses |
| 428 | [ ] Test data seeding is scripted and reproducible — tests do not rely on pre-existing environment state |
| 429 | [ ] The load generator runs on separate infrastructure from the service under test |
| 430 | [ ] CI integration blocks promotion on threshold failure — not just records results |
| 431 | [ ] Soak test has been run at least once to establish a memory and connection pool baseline |
| 432 | [ ] Results comparison to previous run is part of the analysis — not just absolute pass/fail |
| 433 | |
| 434 | ## Anti-Patterns |
| 435 | |
| 436 | [ ] Do not set thresholds without grounding them in actual SLO targets or production baselines — arbitrary numbers produce meaningless pass/fail results |
| 437 | [ ] Do not run the load generator on the same host as the service under test — this contaminates both the test results and the service metrics |
| 438 | [ ] Do not use production user data in load test seeding — all test data must be synthetic, tagged, and cleaned up after each run |
| 439 | [ ] Do not skip the soak test on first deployment — only a soak test reveals slow memory leaks and connection pool exhaustion that short tests miss |
| 440 | [ ] Do not treat a passing baseline test as evidence the service handles spikes — baseline, stress, spike, and soak scenarios test fundamentally different failure modes |
| 441 |
Discussion
Browse more free Claude skills or everything in Development.