Product Health Analysis Skill
Interpret product metrics against goals and surface actionable signals.
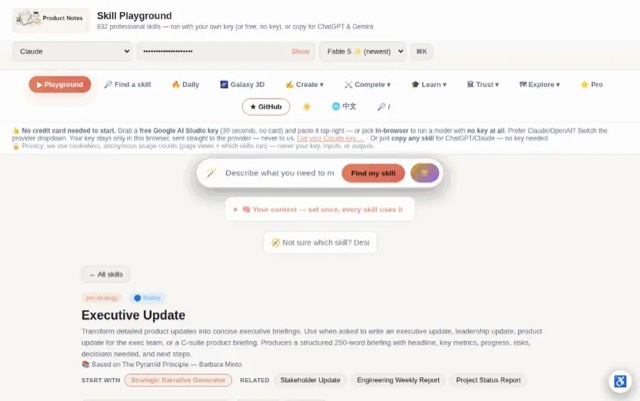

From the mohitagw15856/pm-claude-skills README — shows the whole collection, not only this skill. · view on GitHub
How to use it
Claude Code
- Run the line below. It pulls the whole folder into
~/.claude/skills/product-health-analysis. - Describe your job in plain words. Claude Code follows the skill from there.
npx degit mohitagw15856/pm-claude-skills/skills/product-health-analysis#main ~/.claude/skills/product-health-analysisFor one project only, change the path to .claude/skills/product-health-analysis.
Claude (web or desktop app)
- On this page open ⋯ → Download .md.
- Save it as SKILL.md in a folder, zip the folder, then Customize → Skills → + → Create skill → Upload a skill.
- Pick the file and Save. Claude shows the name and description and runs a security scan.
- Check the skill is switched on.
- Start a new chat and describe your job in plain words. The AI follows the skill from there.
ChatGPT or another app
- ChatGPT: make a Project and paste it into Instructions.
- Neither? Paste it at the top of a new chat — it works for that chat.
Not working?
- Check which app you pasted it into — the steps above name the right one.
- Some skills need the paid tier of Claude or ChatGPT.
Paste into Claude, ChatGPT or Cursor.
Source of Product Health Analysis Skill
Show the full text86 lines
| name | description |
|---|---|
| product-health-analysis | Interpret product metrics against goals and surface actionable signals. Use when asked to analyse product health, review key metrics, investigate a performance issue, produce a health report, or assess product-market fit signals. Produces a structured health report with RAG status, trend analysis, root cause hypotheses, and prioritised actions. |
Product Health Analysis Skill
Transform raw metrics data into a clear health narrative — what's working, what's not, and what needs immediate attention.
Required Inputs
Ask the user for these if not provided:
- Metrics data (current values for key metrics — even rough numbers work)
- Targets or benchmarks (OKR targets, historical baselines, or industry benchmarks)
- Period (week / month / quarter being analysed)
- Product area or segment (are we looking at the whole product or a specific feature?)
Metrics Framework
Analyse across four layers:
- Acquisition — new users, source quality, CAC trends
- Activation — time to first value, onboarding completion rates
- Engagement — DAU/MAU, feature adoption, session depth
- Retention — D1/D7/D30 retention, churn rate, resurrection rate
Process
- For each metric, compare: current period vs. previous period, current vs. target
- Flag anything more than 10% off target as requiring investigation
- Look for correlations — does a drop in activation explain a retention dip 2 weeks later?
- Write a plain-English health summary (no jargon) suitable for sharing with non-data stakeholders
- Recommend top 3 areas for immediate investigation with suggested diagnostic steps
- Validate — Confirm every flagged metric has a plausible root cause hypothesis, not just a raw number, and every recommended action has a specific owner or team
Output Structure
Product Health Report — [Period]
Overall Health: 🟢 On Track / 🟡 Watch / 🔴 Action Required
| Metric | Current | Target | vs. Last Period | Status |
|---|---|---|---|---|
| [metric] | [value] | [target] | [+/-%] | [🟢/🟡/🔴] |
Key Observations: [3-5 bullet observations written in plain English]
Areas Requiring Investigation:
- [Metric + hypothesis + suggested diagnostic]
- [Metric + hypothesis + suggested diagnostic]
- [Metric + hypothesis + suggested diagnostic]
Recommended Actions: [Specific next steps with owners and timelines]
Deeper Materials
This skill ships with support files — use them when they are available:
references/signal-vs-noise.md— Product Health: Separating Signal from Dashboard Noise. Apply it while producing the output; it carries the calibration and judgment calls the method summary above compresses.templates/health-review.md— a fill-in version of the deliverable with the quality gates inline. Offer it when the user wants to work the document themselves rather than have it generated.
Scoring Rubric (0–40)
Score any output of this skill before handing it over; 32+ is ship-quality.
| Dimension | 0 | 5 | 10 |
|---|---|---|---|
| Target & trend discipline | Metrics shown as bare snapshots; no targets or period-over-period comparison | Most metrics have targets and trends, but some RAG statuses don't follow from the numbers or targets are accepted uncritically | Every metric has target, trend, and a status that follows from both — and at least one target is itself challenged if it's no longer meaningful |
| Root cause depth | Movements listed without explanation ("activation dropped 27pts") | Flagged metrics have hypotheses, but they're generic ("onboarding friction") with no diagnostic to confirm them | Every flagged metric has a specific, falsifiable hypothesis plus a named diagnostic step, and at least one cross-metric correlation (e.g. activation → retention lag) is drawn |
| Segment honesty | Only blended aggregates reported; opposing segment trends invisible | Some segment cuts shown, but the headline observations still lean on averages that hide divergence | Every material aggregate is decomposed where segments diverge, and the divergence itself is surfaced as a finding, not a footnote |
| Verdict & actionability | No overall rating, or a rating asserted without evidence; actions missing or ownerless | Overall RAG present and roughly justified; actions exist but some lack owners, dates, or a link to a flagged metric | Overall rating argued from specific evidence (including against the good news), and every action has a named owner, a date, and traces to an investigation or observation |
Quality Checks
- Every metric includes both a target and a trend (not just a snapshot)
- At least one correlation is drawn between metrics (e.g., activation → retention)
- Every flagged metric has a root cause hypothesis, not just "it dropped"
- Observations are written for a non-technical stakeholder (no raw query language or data jargon)
- Overall health rating is justified with specific evidence
Anti-Patterns
- Do not report a single aggregate metric without segment breakdowns — averages hide opposing trends
- Do not flag a metric as healthy just because it is above the target — check if the target itself is meaningful
- Do not list metric movements without root cause hypotheses — observations without explanations are not analysis
- Do not mix product health metrics with business KPIs without explaining the relationship between them
- Do not omit recommended actions — a health report that only describes problems without prioritised next steps is incomplete
| 1 | |
| 2 | name product-health-analysis |
| 3 | description "Interpret product metrics against goals and surface actionable signals. Use when asked to analyse product health, review key metrics, investigate a performance issue, produce a health report, or assess product-market fit signals. Produces a structured health report with RAG status, trend analysis, root cause hypotheses, and prioritised actions." |
| 4 | |
| 5 | |
| 6 | # Product Health Analysis Skill |
| 7 | |
| 8 | Transform raw metrics data into a clear health narrative — what's working, what's not, and what needs immediate attention. |
| 9 | |
| 10 | ## Required Inputs |
| 11 | |
| 12 | Ask the user for these if not provided: |
| 13 | **Metrics data** (current values for key metrics — even rough numbers work) |
| 14 | **Targets or benchmarks** (OKR targets, historical baselines, or industry benchmarks) |
| 15 | **Period** (week / month / quarter being analysed) |
| 16 | **Product area or segment** (are we looking at the whole product or a specific feature?) |
| 17 | |
| 18 | ## Metrics Framework |
| 19 | Analyse across four layers: |
| 20 | **Acquisition** — new users, source quality, CAC trends |
| 21 | **Activation** — time to first value, onboarding completion rates |
| 22 | **Engagement** — DAU/MAU, feature adoption, session depth |
| 23 | **Retention** — D1/D7/D30 retention, churn rate, resurrection rate |
| 24 | |
| 25 | ## Process |
| 26 | For each metric, compare: current period vs. previous period, current vs. target |
| 27 | Flag anything more than 10% off target as requiring investigation |
| 28 | Look for correlations — does a drop in activation explain a retention dip 2 weeks later? |
| 29 | Write a plain-English health summary (no jargon) suitable for sharing with non-data stakeholders |
| 30 | Recommend top 3 areas for immediate investigation with suggested diagnostic steps |
| 31 | **Validate** — Confirm every flagged metric has a plausible root cause hypothesis, not just a raw number, and every recommended action has a specific owner or team |
| 32 | |
| 33 | ## Output Structure |
| 34 | |
| 35 | ### Product Health Report — [Period] |
| 36 | **Overall Health:** 🟢 On Track / 🟡 Watch / 🔴 Action Required |
| 37 | |
| 38 | | Metric | Current | Target | vs. Last Period | Status | |
| 39 | |--------|---------|--------|-----------------|--------| |
| 40 | | [metric] | [value] | [target] | [+/-%] | [🟢/🟡/🔴] | |
| 41 | |
| 42 | **Key Observations:** |
| 43 | [3-5 bullet observations written in plain English] |
| 44 | |
| 45 | **Areas Requiring Investigation:** |
| 46 | [Metric + hypothesis + suggested diagnostic] |
| 47 | [Metric + hypothesis + suggested diagnostic] |
| 48 | [Metric + hypothesis + suggested diagnostic] |
| 49 | |
| 50 | **Recommended Actions:** |
| 51 | [Specific next steps with owners and timelines] |
| 52 | |
| 53 | ## Deeper Materials |
| 54 | |
| 55 | This skill ships with support files — use them when they are available: |
| 56 | |
| 57 | **`references/signal-vs-noise.md`** — Product Health: Separating Signal from Dashboard Noise. Apply it while producing the output; it carries the calibration and judgment calls the method summary above compresses. |
| 58 | **`templates/health-review.md`** — a fill-in version of the deliverable with the quality gates inline. Offer it when the user wants to work the document themselves rather than have it generated. |
| 59 | |
| 60 | ## Scoring Rubric (0–40) |
| 61 | |
| 62 | Score any output of this skill before handing it over; 32+ is ship-quality. |
| 63 | |
| 64 | | Dimension | 0 | 5 | 10 | |
| 65 | |---|---|---|---| |
| 66 | | Target & trend discipline | Metrics shown as bare snapshots; no targets or period-over-period comparison | Most metrics have targets and trends, but some RAG statuses don't follow from the numbers or targets are accepted uncritically | Every metric has target, trend, and a status that follows from both — and at least one target is itself challenged if it's no longer meaningful | |
| 67 | | Root cause depth | Movements listed without explanation ("activation dropped 27pts") | Flagged metrics have hypotheses, but they're generic ("onboarding friction") with no diagnostic to confirm them | Every flagged metric has a specific, falsifiable hypothesis plus a named diagnostic step, and at least one cross-metric correlation (e.g. activation → retention lag) is drawn | |
| 68 | | Segment honesty | Only blended aggregates reported; opposing segment trends invisible | Some segment cuts shown, but the headline observations still lean on averages that hide divergence | Every material aggregate is decomposed where segments diverge, and the divergence itself is surfaced as a finding, not a footnote | |
| 69 | | Verdict & actionability | No overall rating, or a rating asserted without evidence; actions missing or ownerless | Overall RAG present and roughly justified; actions exist but some lack owners, dates, or a link to a flagged metric | Overall rating argued from specific evidence (including against the good news), and every action has a named owner, a date, and traces to an investigation or observation | |
| 70 | |
| 71 | ## Quality Checks |
| 72 | |
| 73 | [ ] Every metric includes both a target and a trend (not just a snapshot) |
| 74 | [ ] At least one correlation is drawn between metrics (e.g., activation → retention) |
| 75 | [ ] Every flagged metric has a root cause hypothesis, not just "it dropped" |
| 76 | [ ] Observations are written for a non-technical stakeholder (no raw query language or data jargon) |
| 77 | [ ] Overall health rating is justified with specific evidence |
| 78 | |
| 79 | ## Anti-Patterns |
| 80 | |
| 81 | [ ] Do not report a single aggregate metric without segment breakdowns — averages hide opposing trends |
| 82 | [ ] Do not flag a metric as healthy just because it is above the target — check if the target itself is meaningful |
| 83 | [ ] Do not list metric movements without root cause hypotheses — observations without explanations are not analysis |
| 84 | [ ] Do not mix product health metrics with business KPIs without explaining the relationship between them |
| 85 | [ ] Do not omit recommended actions — a health report that only describes problems without prioritised next steps is incomplete |
| 86 |
Discussion
Browse more free Claude skills or everything in Data & analytics.