Data Analysis Standard Skill
Structure a product data analysis, metric deep-dive, funnel analysis, or cohort study.
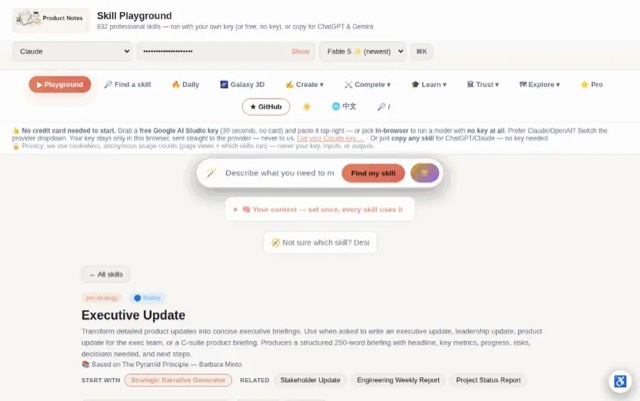

From the mohitagw15856/pm-claude-skills README — shows the whole collection, not only this skill. · view on GitHub
How to use it
Claude Code
- Run the line below. It pulls the whole folder into
~/.claude/skills/data-analysis-standard. - Describe your job in plain words. Claude Code follows the skill from there.
npx degit mohitagw15856/pm-claude-skills/skills/data-analysis-standard#main ~/.claude/skills/data-analysis-standardFor one project only, change the path to .claude/skills/data-analysis-standard.
Claude (web or desktop app)
- On this page open ⋯ → Download .md.
- Save it as SKILL.md in a folder, zip the folder, then Customize → Skills → + → Create skill → Upload a skill.
- Pick the file and Save. Claude shows the name and description and runs a security scan.
- Check the skill is switched on.
- Start a new chat and describe your job in plain words. The AI follows the skill from there.
ChatGPT or another app
- ChatGPT: make a Project and paste it into Instructions.
- Neither? Paste it at the top of a new chat — it works for that chat.
Not working?
- Check which app you pasted it into — the steps above name the right one.
- Some skills need the paid tier of Claude or ChatGPT.
Paste into Claude, ChatGPT or Cursor.
Source of Data Analysis Standard Skill
Show the full text153 lines
| name | description |
|---|---|
| data-analysis-standard | Structure a product data analysis, metric deep-dive, funnel analysis, or cohort study. Use when asked to analyse product metrics, investigate a drop in conversion, explain a data change to stakeholders, or find the root cause of a metric movement. Produces a structured analysis with question, root cause, confidence level, and recommended action. |
Data Analysis Standard Skill
Turn raw numbers into product decisions. Structure every analysis with a clear question, methodology, finding, and recommended action.
Analysis Framework: The 4-Question Method
Every analysis starts here:
- What changed? (describe the metric and its movement)
- Why did it change? (root cause — segment, funnel step, cohort, channel)
- So what? (business or product impact)
- Now what? (recommended action with confidence level)
Never deliver data without answering all four. A chart with no narrative is not an analysis.
Metric Triage Template
Use when a metric has moved unexpectedly:
METRIC: [Name]
MOVEMENT: [X% change over Y period]
BASELINE: [What was normal]

SEGMENTATION CHECK:
- By platform (iOS / Android / Web)?
- By user cohort (new / returning / power users)?
- By acquisition channel?
- By geography?
- By plan/tier?

ROOT CAUSE HYPOTHESIS:
1. [Most likely explanation] — Evidence: [data point]
2. [Alternative explanation] — Evidence: [data point]
3. [Ruling out] — Eliminated because: [reason]

CONCLUSION: [Single sentence answer to "why did this change?"]
CONFIDENCE: [High / Medium / Low] — based on [data available]
Funnel Analysis Structure
| Stage | Metric | Current | Benchmark/Target | Drop-off % | Notes |
|---|---|---|---|---|---|
| [Top of funnel] | [Users] | [N] | [N] | — | |
| [Step 2] | [Users] | [N] | [N] | [X%] | |
| [Step 3] | [Users] | [N] | [N] | [X%] | |
| [Conversion] | [Users] | [N] | [N] | [X%] |
Biggest drop-off: [Step X → Step Y] — Hypothesis: [reason] Recommended investigation: [specific query or test]
Cohort Analysis Guidelines
Always define:
- Cohort definition: [What groups users — signup week, first action, plan type]
- Retention metric: [What counts as retained — login, core action, revenue]
- Retention window: [D1, D7, D30, W4, M3, etc.]
Output a cohort retention table and annotate:
- Baseline retention for each cohort
- Cohorts that over/underperform and why (feature launch? campaign? seasonal?)
- Trend direction across cohorts (improving / declining / stable)
Stakeholder Analysis Output Format
[Analysis Title] — [Date]
Question being answered: [Specific question in plain English] Time period: [Date range] Data source: [Where data comes from]
Finding:
[1–2 sentence plain-English summary of what the data shows]
Key chart / table: [Include or describe]
Root cause: [Best explanation with evidence]
Confidence level: [High / Medium / Low] — [reason]
Recommended action:
- [Immediate action — owner, timeline]
- [Investigation needed — what to check next]
- [Monitoring — what metric to watch and at what cadence]
What this analysis does NOT tell us: [Important caveat — what data is missing or what can't be concluded]
Required Inputs
Ask the user for these if not provided:
- Metric or question being investigated
- Time period (what changed, from when to when)
- Data available (which segments, sources, or queries you have access to)
- Business context (what decision this analysis informs)
- Audience (who will read this — exec / team / data team)
Deeper Materials
This skill ships with support files — use them when they are available:
references/analysis-integrity.md— Analysis Integrity: the Checks Between Query and Conclusion. Apply it while producing the output; it carries the calibration and judgment calls the method summary above compresses.templates/analysis-writeup.md— a fill-in version of the deliverable with the quality gates inline. Offer it when the user wants to work the document themselves rather than have it generated.
Scoring Rubric (0–40)
Score any output of this skill before handing it over; 32+ is ship-quality.
| Dimension | 0 | 5 | 10 |
|---|---|---|---|
| Four-question completeness | Describes what changed and stops | Covers what/why but "so what / now what" are thin | All four answered with proportionate depth; the "now what" is decision-ready |
| Evidence behind the root cause | Root cause asserted from intuition | One supporting data point, alternatives unexamined | Root cause tested against at least one rival explanation, with the discriminating evidence shown |
| Uncertainty honesty | Reads as certain; no confidence statement | Confidence stated but not justified | Confidence level justified, and "what the data cannot tell us" names the real blind spots, not token ones |
| Actionability | Findings with no action | Action named but ownerless or dateless | Recommended action has an owner, a timeline, and a stated expected effect worth checking later |
Quality Checks
- Analysis answers all 4 questions: what changed, why, so what, now what
- Root cause has evidence (not just hypothesis)
- Confidence level is stated and justified
- What the data cannot tell us is explicitly named
- Recommended action includes an owner and timeline
Anti-Patterns
- Do not present correlations as causation — always state the distinction explicitly
- Do not report a metric movement without stating the time window and comparison baseline
- Do not skip the "so what" — raw observations without recommended actions are incomplete analysis
- Do not overstate confidence — label hypotheses clearly and note what data would be needed to confirm them
- Do not ignore segment breakdowns — aggregate metrics can mask opposing trends in sub-segments
Guidelines
- Always state what the data cannot tell you — never oversell confidence
- Correlations are not causation — flag this every time
- If the user has no baseline, recommend establishing one before drawing conclusions
- Recommend the simplest chart for each finding: bar for comparison, line for trends, scatter for correlation, table for detailed breakdowns
- Always specify the time window — "conversion dropped" is meaningless without "from X to Y over Z period"
| 1 | |
| 2 | name data-analysis-standard |
| 3 | description "Structure a product data analysis, metric deep-dive, funnel analysis, or cohort study. Use when asked to analyse product metrics, investigate a drop in conversion, explain a data change to stakeholders, or find the root cause of a metric movement. Produces a structured analysis with question, root cause, confidence level, and recommended action." |
| 4 | |
| 5 | |
| 6 | # Data Analysis Standard Skill |
| 7 | |
| 8 | Turn raw numbers into product decisions. Structure every analysis with a clear question, methodology, finding, and recommended action. |
| 9 | |
| 10 | ## Analysis Framework: The 4-Question Method |
| 11 | |
| 12 | Every analysis starts here: |
| 13 | **What changed?** (describe the metric and its movement) |
| 14 | **Why did it change?** (root cause — segment, funnel step, cohort, channel) |
| 15 | **So what?** (business or product impact) |
| 16 | **Now what?** (recommended action with confidence level) |
| 17 | |
| 18 | Never deliver data without answering all four. A chart with no narrative is not an analysis. |
| 19 | |
| 20 | |
| 21 | |
| 22 | ## Metric Triage Template |
| 23 | |
| 24 | Use when a metric has moved unexpectedly: |
| 25 | |
| 26 | |
| 27 | METRIC: [Name] |
| 28 | MOVEMENT: [X% change over Y period] |
| 29 | BASELINE: [What was normal] |
| 30 | |
| 31 | SEGMENTATION CHECK: |
| 32 | - By platform (iOS / Android / Web)? |
| 33 | - By user cohort (new / returning / power users)? |
| 34 | - By acquisition channel? |
| 35 | - By geography? |
| 36 | - By plan/tier? |
| 37 | |
| 38 | ROOT CAUSE HYPOTHESIS: |
| 39 | 1. [Most likely explanation] — Evidence: [data point] |
| 40 | 2. [Alternative explanation] — Evidence: [data point] |
| 41 | 3. [Ruling out] — Eliminated because: [reason] |
| 42 | |
| 43 | CONCLUSION: [Single sentence answer to "why did this change?"] |
| 44 | CONFIDENCE: [High / Medium / Low] — based on [data available] |
| 45 | |
| 46 | |
| 47 | |
| 48 | |
| 49 | ## Funnel Analysis Structure |
| 50 | |
| 51 | | Stage | Metric | Current | Benchmark/Target | Drop-off % | Notes | |
| 52 | |---|---|---|---|---|---| |
| 53 | | [Top of funnel] | [Users] | [N] | [N] | — | | |
| 54 | | [Step 2] | [Users] | [N] | [N] | [X%] | | |
| 55 | | [Step 3] | [Users] | [N] | [N] | [X%] | | |
| 56 | | [Conversion] | [Users] | [N] | [N] | [X%] | | |
| 57 | |
| 58 | **Biggest drop-off:** [Step X → Step Y] — Hypothesis: [reason] |
| 59 | **Recommended investigation:** [specific query or test] |
| 60 | |
| 61 | |
| 62 | |
| 63 | ## Cohort Analysis Guidelines |
| 64 | |
| 65 | Always define: |
| 66 | **Cohort definition:** [What groups users — signup week, first action, plan type] |
| 67 | **Retention metric:** [What counts as retained — login, core action, revenue] |
| 68 | **Retention window:** [D1, D7, D30, W4, M3, etc.] |
| 69 | |
| 70 | Output a cohort retention table and annotate: |
| 71 | Baseline retention for each cohort |
| 72 | Cohorts that over/underperform and why (feature launch? campaign? seasonal?) |
| 73 | Trend direction across cohorts (improving / declining / stable) |
| 74 | |
| 75 | |
| 76 | |
| 77 | ## Stakeholder Analysis Output Format |
| 78 | |
| 79 | ### [Analysis Title] — [Date] |
| 80 | |
| 81 | **Question being answered:** [Specific question in plain English] |
| 82 | **Time period:** [Date range] |
| 83 | **Data source:** [Where data comes from] |
| 84 | |
| 85 | **Finding:** |
| 86 | > [1–2 sentence plain-English summary of what the data shows] |
| 87 | |
| 88 | **Key chart / table:** [Include or describe] |
| 89 | |
| 90 | **Root cause:** [Best explanation with evidence] |
| 91 | |
| 92 | **Confidence level:** [High / Medium / Low] — [reason] |
| 93 | |
| 94 | **Recommended action:** |
| 95 | [Immediate action — owner, timeline] |
| 96 | [Investigation needed — what to check next] |
| 97 | [Monitoring — what metric to watch and at what cadence] |
| 98 | |
| 99 | **What this analysis does NOT tell us:** [Important caveat — what data is missing or what can't be concluded] |
| 100 | |
| 101 | |
| 102 | |
| 103 | ## Required Inputs |
| 104 | |
| 105 | Ask the user for these if not provided: |
| 106 | **Metric or question** being investigated |
| 107 | **Time period** (what changed, from when to when) |
| 108 | **Data available** (which segments, sources, or queries you have access to) |
| 109 | **Business context** (what decision this analysis informs) |
| 110 | **Audience** (who will read this — exec / team / data team) |
| 111 | |
| 112 | ## Deeper Materials |
| 113 | |
| 114 | This skill ships with support files — use them when they are available: |
| 115 | |
| 116 | **`references/analysis-integrity.md`** — Analysis Integrity: the Checks Between Query and Conclusion. Apply it while producing the output; it carries the calibration and judgment calls the method summary above compresses. |
| 117 | **`templates/analysis-writeup.md`** — a fill-in version of the deliverable with the quality gates inline. Offer it when the user wants to work the document themselves rather than have it generated. |
| 118 | |
| 119 | ## Scoring Rubric (0–40) |
| 120 | |
| 121 | Score any output of this skill before handing it over; 32+ is ship-quality. |
| 122 | |
| 123 | | Dimension | 0 | 5 | 10 | |
| 124 | |---|---|---|---| |
| 125 | | Four-question completeness | Describes what changed and stops | Covers what/why but "so what / now what" are thin | All four answered with proportionate depth; the "now what" is decision-ready | |
| 126 | | Evidence behind the root cause | Root cause asserted from intuition | One supporting data point, alternatives unexamined | Root cause tested against at least one rival explanation, with the discriminating evidence shown | |
| 127 | | Uncertainty honesty | Reads as certain; no confidence statement | Confidence stated but not justified | Confidence level justified, and "what the data cannot tell us" names the real blind spots, not token ones | |
| 128 | | Actionability | Findings with no action | Action named but ownerless or dateless | Recommended action has an owner, a timeline, and a stated expected effect worth checking later | |
| 129 | |
| 130 | ## Quality Checks |
| 131 | |
| 132 | [ ] Analysis answers all 4 questions: what changed, why, so what, now what |
| 133 | [ ] Root cause has evidence (not just hypothesis) |
| 134 | [ ] Confidence level is stated and justified |
| 135 | [ ] What the data cannot tell us is explicitly named |
| 136 | [ ] Recommended action includes an owner and timeline |
| 137 | |
| 138 | ## Anti-Patterns |
| 139 | |
| 140 | [ ] Do not present correlations as causation — always state the distinction explicitly |
| 141 | [ ] Do not report a metric movement without stating the time window and comparison baseline |
| 142 | [ ] Do not skip the "so what" — raw observations without recommended actions are incomplete analysis |
| 143 | [ ] Do not overstate confidence — label hypotheses clearly and note what data would be needed to confirm them |
| 144 | [ ] Do not ignore segment breakdowns — aggregate metrics can mask opposing trends in sub-segments |
| 145 | |
| 146 | ## Guidelines |
| 147 | |
| 148 | Always state what the data *cannot* tell you — never oversell confidence |
| 149 | Correlations are not causation — flag this every time |
| 150 | If the user has no baseline, recommend establishing one before drawing conclusions |
| 151 | Recommend the simplest chart for each finding: bar for comparison, line for trends, scatter for correlation, table for detailed breakdowns |
| 152 | Always specify the time window — "conversion dropped" is meaningless without "from X to Y over Z period" |
| 153 |
Discussion
Browse more free Claude skills or everything in Data & analytics.