Performance optimization
Diagnose and fix web performance issues including Core Web Vitals (LCP, INP, CLS), bundle size, asset optimization, render performance, and runtime efficiency.
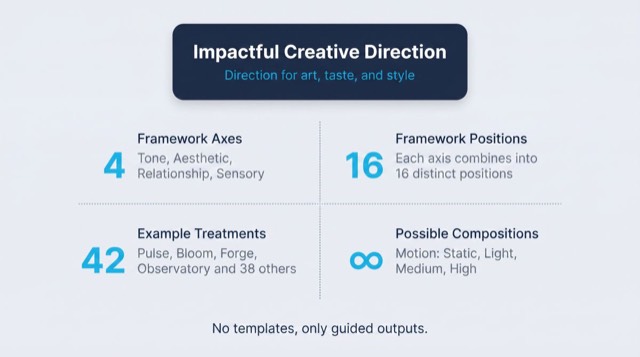
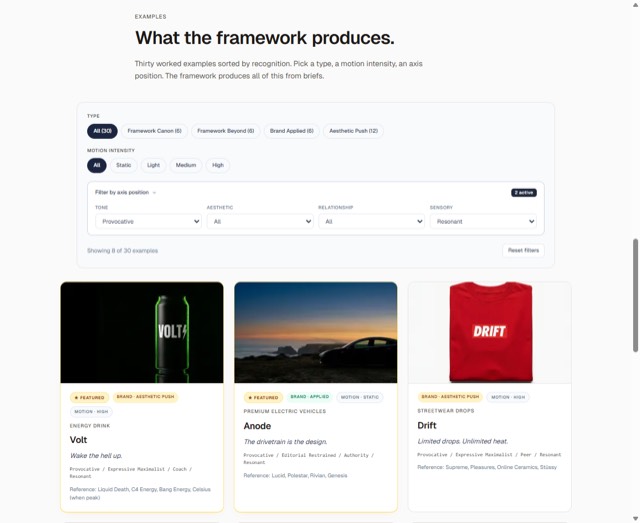
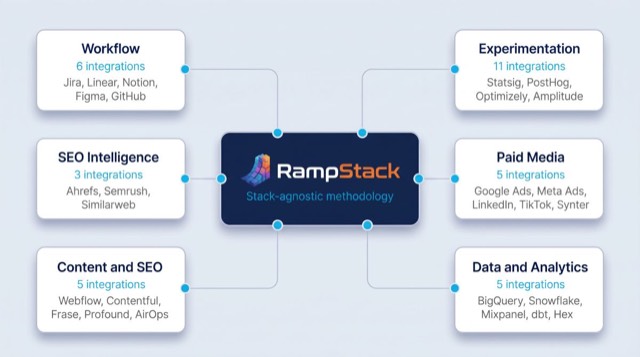
From the rampstackco/claude-skills README — shows the whole collection, not only this skill. · view on GitHub
How to use it
Claude Code
- Run the line below. It pulls the whole folder into
~/.claude/skills/performance-optimization, including the files SKILL.md points to. - Describe your job in plain words. Claude Code follows the skill from there.
npx degit rampstackco/claude-skills/skills/performance-optimization#main ~/.claude/skills/performance-optimizationFor one project only, change the path to .claude/skills/performance-optimization. This skill also uses moment.js, performance-audit.md — copying SKILL.md alone won't be enough. See the folder on GitHub.
Claude (web or desktop app)
- On this page open ⋯ → Download .md.
- Save it as SKILL.md in a folder, zip the folder, then Customize → Skills → + → Create skill → Upload a skill.
- Pick the file and Save. Claude shows the name and description and runs a security scan.
- Check the skill is switched on.
- Start a new chat and describe your job in plain words. The AI follows the skill from there.
ChatGPT or another app
- ChatGPT: make a Project and paste it into Instructions.
- Neither? Paste it at the top of a new chat — it works for that chat.
Not working?
- Check which app you pasted it into — the steps above name the right one.
- Some skills need the paid tier of Claude or ChatGPT.
Paste into Claude, ChatGPT or Cursor.
Source of Performance optimization
Show the full text281 lines
| name | description | category | catalog_summary | display_order |
|---|---|---|---|---|
| performance-optimization | Diagnose and fix web performance issues including Core Web Vitals (LCP, INP, CLS), bundle size, asset optimization, render performance, and runtime efficiency. Use this skill whenever the user wants to improve page speed, fix Core Web Vitals, optimize assets, reduce bundle size, debug slow renders, or systematically improve a site's performance. Triggers on performance, page speed, Core Web Vitals, LCP, INP, CLS, FID, TTFB, bundle size, code splitting, image optimization, lazy loading, render blocking, slow page, performance audit, Lighthouse score. Also triggers when traffic or conversion is dropping due to perceived slowness. | development | Core Web Vitals, asset optimization, render performance | 4 |
Performance Optimization
Diagnose web performance issues and produce a remediation plan. Stack-agnostic. Anchored to Core Web Vitals and standard browser performance patterns.
This skill goes deeper than the performance checks in qa-testing and seo-technical. Use this when performance itself is the goal.
When to use
- Fixing Core Web Vitals (LCP, INP, CLS)
- Diagnosing slow page loads
- Reducing JavaScript bundle size
- Optimizing images, fonts, and other assets
- Fixing layout shift, render-blocking resources, jank
- Pre-launch performance verification
- Annual performance health check
When NOT to use
- General QA after deploys (use
qa-testing) - Technical SEO including indexing and crawling (use
seo-technical) - Code review for general bugs (use
code-review-web)
Required inputs
- The site or page under audit
- Specific performance complaints if any
- Target metrics (Core Web Vitals thresholds, Lighthouse score, custom)
- Browser dev tools access
- Performance monitoring data if available (Real User Monitoring, lab data)
The framework: Core Web Vitals
Three metrics carry most of the weight for both user experience and SEO:
LCP (Largest Contentful Paint)
What it measures: Time until the largest visible content element finishes rendering.
Targets:
- Good: under 2.5 seconds
- Needs improvement: 2.5 to 4.0 seconds
- Poor: over 4.0 seconds
Common causes of poor LCP:
- Slow server response time (TTFB over 800ms)
- Render-blocking JavaScript or CSS
- Large unoptimized images for the LCP element
- Late-loading fonts that delay text render
- Client-side rendering of the LCP element
Common fixes:
- Server-render the LCP element (no client-side render)
- Optimize the LCP image (right format, right size, preloaded)
- Reduce render-blocking resources (defer non-critical CSS and JS)
- Use modern image formats (WebP, AVIF)
- Specify image dimensions to skip layout pass
INP (Interaction to Next Paint)
What it measures: Responsiveness to user interactions. Replaces FID as the standard interactivity metric.
Targets:
- Good: under 200ms
- Needs improvement: 200 to 500ms
- Poor: over 500ms
Common causes of poor INP:
- Long-running JavaScript blocking the main thread
- Heavy event handlers
- Excessive React/framework re-renders
- Synchronous operations in event handlers
- Large DOM with expensive layouts
Common fixes:
- Break long tasks into chunks (
scheduler.yield()orsetTimeout) - Memoize expensive computations
- Debounce or throttle high-frequency event handlers (scroll, mousemove, input)
- Avoid synchronous storage or DOM operations in handlers
- Reduce DOM size (under 1500 elements ideal)
- Use CSS over JS for animations where possible
CLS (Cumulative Layout Shift)
What it measures: How much the page jumps around as it loads. Unexpected layout shifts hurt usability.
Targets:
- Good: under 0.1
- Needs improvement: 0.1 to 0.25
- Poor: over 0.25
Common causes of poor CLS:
- Images without explicit dimensions
- Ads, embeds, iframes that load late
- Dynamically injected content above existing content
- Web fonts causing FOIT/FOUT (flash of invisible/unstyled text)
- CSS that depends on JS-loaded data
Common fixes:
- Always specify
widthandheight(oraspect-ratio) on images and videos - Reserve space for ads and embeds before they load
- Use
font-display: optionalorfont-display: swapthoughtfully - Avoid injecting content above the fold after initial render
- Preload critical fonts
Beyond Core Web Vitals
Time to First Byte (TTFB)
The server response time. Bad TTFB makes everything else worse.
Targets: under 800ms ideal.
Common causes:
- Slow database queries on the request path
- N+1 query patterns
- Missing caching
- Server geographic distance from users (no CDN)
- Cold starts on serverless
Fixes:
- Cache database queries
- Use a CDN for static and cacheable dynamic content
- Optimize critical-path queries
- Pre-render where possible (SSG, ISR)
- Edge functions for low-latency dynamic content
Bundle size
JavaScript shipped to the browser.
Targets:
- Initial JS under 170KB compressed for typical pages
- Lazy-loaded chunks under 100KB compressed each
Common causes of bloat:
- Importing entire libraries when only one function is used
- Bundling polyfills for modern browsers
- Including dev-only code in production
- Duplicate dependencies (multiple versions of the same library)
- Large client-side state (Redux store snapshots, etc.)
Fixes:
- Tree-shake imports (
import { fn } from 'lib'notimport lib from 'lib') - Code-split per route
- Lazy-load below-the-fold components
- Audit dependencies; replace heavy ones (e.g., moment.js → date-fns or native Intl)
- Build-time bundle analyzer to spot bloat
- Dynamic imports for rarely-used features
Image optimization
Images are typically 60 to 80 percent of page weight.
Best practices:
- Modern formats: WebP everywhere supported, AVIF where supported
- Responsive images:
srcsetfor different viewport sizes - Lazy loading:
loading="lazy"for below-the-fold - Explicit dimensions: prevents CLS
- Right size: don't ship 4000px images for 800px display
- LCP image: preload, never lazy-load
Font loading
Web fonts often delay text render and cause CLS.
Best practices:
- Self-host fonts (avoid third-party blocking)
- Preload critical fonts (
<link rel="preload" as="font">) - Use
font-display: swapfor non-critical fonts - Subset fonts to remove unused glyphs
- Use variable fonts where possible
- Provide system-font fallback that visually matches
Third-party scripts
Third parties (analytics, ads, chat widgets) often dominate performance budgets.
Audit each:
- Is it required?
- Can it load after page interaction (defer)?
- Can it run from a worker (off main thread)?
- Is the third party itself fast?
- Are there lighter-weight alternatives?
A common pattern: 50 percent of performance issues come from third-party scripts.
Workflow
- Establish a baseline. Lighthouse scan, WebPageTest run, or Real User Monitoring data. Capture current Core Web Vitals.
- Identify the worst offender. LCP, INP, or CLS - which is failing? Focus there first.
- Diagnose specifically. Browser dev tools (Performance tab, Network tab, Coverage tab). Identify the actual cause of the metric failure.
- Plan fixes. Per identified issue, plan a specific change. Estimate impact and effort.
- Implement. One fix at a time where possible. Easier to measure impact.
- Re-measure. After each major fix, re-run Lighthouse and check Real User Monitoring.
- Iterate. Performance is rarely solved in one pass. Plan for ongoing monitoring and fixes.
Tools
Lab tools (run on demand):
- Lighthouse (built into Chrome DevTools)
- PageSpeed Insights (online)
- WebPageTest (online, more configurable)
- Browser Performance tab (deep flame graph analysis)
Field tools (real user data):
- Chrome User Experience Report (CrUX) - public data for any site
- Real User Monitoring (RUM) - your own users (DataDog, New Relic, custom, etc.)
- Search Console Core Web Vitals report
Lab tools are useful for diagnosis. Field tools are the source of truth for what users actually experience.
Failure patterns
- Optimizing without measuring. Performance theater without baseline metrics. Always measure first.
- Optimizing the wrong metric. A great Lighthouse score with bad real-user metrics means your test conditions don't match users.
- Over-optimizing. Spending weeks shaving 10ms off TTFB while CLS is 0.4. Fix the worst offender first.
- Lighthouse-driven optimization only. Lighthouse runs in idealized conditions. Always check field data.
- Single-page optimization. Performance regressions creep in across the codebase. Build performance budgets and CI checks.
- Treating every byte as equal. A render-blocking 100KB script is worse than a deferred 500KB script.
- Bundle size obsession. Bundle size matters, but execution time matters more. A small bundle that takes 5 seconds to parse is worse than a larger bundle that runs fast.
- Ignoring third parties. "It's the analytics tag, not us." Third parties run on your domain in your users' eyes. Own them.
Output format
Default output is a performance report at performance-audit.md.
Structure:
- Executive summary
- Methodology (tools, conditions, sample pages)
- Current state (Core Web Vitals, Lighthouse scores, RUM data)
- Critical issues (Core Web Vitals failures)
- Important issues (sub-optimal but not failing)
- Polish (further-than-required wins)
- Remediation roadmap (sequenced)
- Performance budget recommendations
- Monitoring plan
For complex audits, include:
- Per-page Lighthouse exports
- Bundle analysis output
- Network waterfall screenshots
- Specific code snippets to change
If required data is unavailable
This skill's output depends on data, measurements, or tool results it cannot generate on its own. When a required input, tool, or data source is unavailable or unverifiable, the sanctioned output is the deliverable with the gap stated: what was needed, what was actually obtained or verified, and which parts of the output are affected. Fabricating, estimating, or interpolating a required number to complete the deliverable is never sanctioned. A stated gap is a complete answer.
Reference files
references/audit-template.md- Full performance audit report template.references/optimization-checklist.md- Quick-reference checklist of common optimizations by priority.references/optimization-playbook.md- Symptom-to-fix playbook for the common Core Web Vitals problems (LCP, INP, CLS).
| 1 | |
| 2 | name performance-optimization |
| 3 | description "Diagnose and fix web performance issues including Core Web Vitals (LCP, INP, CLS), bundle size, asset optimization, render performance, and runtime efficiency. Use this skill whenever the user wants to improve page speed, fix Core Web Vitals, optimize assets, reduce bundle size, debug slow renders, or systematically improve a site's performance. Triggers on performance, page speed, Core Web Vitals, LCP, INP, CLS, FID, TTFB, bundle size, code splitting, image optimization, lazy loading, render blocking, slow page, performance audit, Lighthouse score. Also triggers when traffic or conversion is dropping due to perceived slowness." |
| 4 | category development |
| 5 | catalog_summary "Core Web Vitals, asset optimization, render performance" |
| 6 | display_order 4 |
| 7 | |
| 8 | |
| 9 | # Performance Optimization |
| 10 | |
| 11 | Diagnose web performance issues and produce a remediation plan. Stack-agnostic. Anchored to Core Web Vitals and standard browser performance patterns. |
| 12 | |
| 13 | This skill goes deeper than the performance checks in `qa-testing` and `seo-technical`. Use this when performance itself is the goal. |
| 14 | |
| 15 | |
| 16 | |
| 17 | ## When to use |
| 18 | |
| 19 | Fixing Core Web Vitals (LCP, INP, CLS) |
| 20 | Diagnosing slow page loads |
| 21 | Reducing JavaScript bundle size |
| 22 | Optimizing images, fonts, and other assets |
| 23 | Fixing layout shift, render-blocking resources, jank |
| 24 | Pre-launch performance verification |
| 25 | Annual performance health check |
| 26 | |
| 27 | ## When NOT to use |
| 28 | |
| 29 | General QA after deploys (use `qa-testing`) |
| 30 | Technical SEO including indexing and crawling (use `seo-technical`) |
| 31 | Code review for general bugs (use `code-review-web`) |
| 32 | |
| 33 | |
| 34 | |
| 35 | ## Required inputs |
| 36 | |
| 37 | The site or page under audit |
| 38 | Specific performance complaints if any |
| 39 | Target metrics (Core Web Vitals thresholds, Lighthouse score, custom) |
| 40 | Browser dev tools access |
| 41 | Performance monitoring data if available (Real User Monitoring, lab data) |
| 42 | |
| 43 | |
| 44 | |
| 45 | ## The framework: Core Web Vitals |
| 46 | |
| 47 | Three metrics carry most of the weight for both user experience and SEO: |
| 48 | |
| 49 | ### LCP (Largest Contentful Paint) |
| 50 | |
| 51 | **What it measures:** Time until the largest visible content element finishes rendering. |
| 52 | |
| 53 | **Targets:** |
| 54 | Good: under 2.5 seconds |
| 55 | Needs improvement: 2.5 to 4.0 seconds |
| 56 | Poor: over 4.0 seconds |
| 57 | |
| 58 | **Common causes of poor LCP:** |
| 59 | Slow server response time (TTFB over 800ms) |
| 60 | Render-blocking JavaScript or CSS |
| 61 | Large unoptimized images for the LCP element |
| 62 | Late-loading fonts that delay text render |
| 63 | Client-side rendering of the LCP element |
| 64 | |
| 65 | **Common fixes:** |
| 66 | Server-render the LCP element (no client-side render) |
| 67 | Optimize the LCP image (right format, right size, preloaded) |
| 68 | Reduce render-blocking resources (defer non-critical CSS and JS) |
| 69 | Use modern image formats (WebP, AVIF) |
| 70 | Specify image dimensions to skip layout pass |
| 71 | |
| 72 | ### INP (Interaction to Next Paint) |
| 73 | |
| 74 | **What it measures:** Responsiveness to user interactions. Replaces FID as the standard interactivity metric. |
| 75 | |
| 76 | **Targets:** |
| 77 | Good: under 200ms |
| 78 | Needs improvement: 200 to 500ms |
| 79 | Poor: over 500ms |
| 80 | |
| 81 | **Common causes of poor INP:** |
| 82 | Long-running JavaScript blocking the main thread |
| 83 | Heavy event handlers |
| 84 | Excessive React/framework re-renders |
| 85 | Synchronous operations in event handlers |
| 86 | Large DOM with expensive layouts |
| 87 | |
| 88 | **Common fixes:** |
| 89 | Break long tasks into chunks (`scheduler.yield()` or `setTimeout`) |
| 90 | Memoize expensive computations |
| 91 | Debounce or throttle high-frequency event handlers (scroll, mousemove, input) |
| 92 | Avoid synchronous storage or DOM operations in handlers |
| 93 | Reduce DOM size (under 1500 elements ideal) |
| 94 | Use CSS over JS for animations where possible |
| 95 | |
| 96 | ### CLS (Cumulative Layout Shift) |
| 97 | |
| 98 | **What it measures:** How much the page jumps around as it loads. Unexpected layout shifts hurt usability. |
| 99 | |
| 100 | **Targets:** |
| 101 | Good: under 0.1 |
| 102 | Needs improvement: 0.1 to 0.25 |
| 103 | Poor: over 0.25 |
| 104 | |
| 105 | **Common causes of poor CLS:** |
| 106 | Images without explicit dimensions |
| 107 | Ads, embeds, iframes that load late |
| 108 | Dynamically injected content above existing content |
| 109 | Web fonts causing FOIT/FOUT (flash of invisible/unstyled text) |
| 110 | CSS that depends on JS-loaded data |
| 111 | |
| 112 | **Common fixes:** |
| 113 | Always specify `width` and `height` (or `aspect-ratio`) on images and videos |
| 114 | Reserve space for ads and embeds before they load |
| 115 | Use `font-display: optional` or `font-display: swap` thoughtfully |
| 116 | Avoid injecting content above the fold after initial render |
| 117 | Preload critical fonts |
| 118 | |
| 119 | |
| 120 | |
| 121 | ## Beyond Core Web Vitals |
| 122 | |
| 123 | ### Time to First Byte (TTFB) |
| 124 | |
| 125 | The server response time. Bad TTFB makes everything else worse. |
| 126 | |
| 127 | **Targets:** under 800ms ideal. |
| 128 | |
| 129 | **Common causes:** |
| 130 | Slow database queries on the request path |
| 131 | N+1 query patterns |
| 132 | Missing caching |
| 133 | Server geographic distance from users (no CDN) |
| 134 | Cold starts on serverless |
| 135 | |
| 136 | **Fixes:** |
| 137 | Cache database queries |
| 138 | Use a CDN for static and cacheable dynamic content |
| 139 | Optimize critical-path queries |
| 140 | Pre-render where possible (SSG, ISR) |
| 141 | Edge functions for low-latency dynamic content |
| 142 | |
| 143 | ### Bundle size |
| 144 | |
| 145 | JavaScript shipped to the browser. |
| 146 | |
| 147 | **Targets:** |
| 148 | Initial JS under 170KB compressed for typical pages |
| 149 | Lazy-loaded chunks under 100KB compressed each |
| 150 | |
| 151 | **Common causes of bloat:** |
| 152 | Importing entire libraries when only one function is used |
| 153 | Bundling polyfills for modern browsers |
| 154 | Including dev-only code in production |
| 155 | Duplicate dependencies (multiple versions of the same library) |
| 156 | Large client-side state (Redux store snapshots, etc.) |
| 157 | |
| 158 | **Fixes:** |
| 159 | Tree-shake imports (`import { fn } from 'lib'` not `import lib from 'lib'`) |
| 160 | Code-split per route |
| 161 | Lazy-load below-the-fold components |
| 162 | Audit dependencies; replace heavy ones (e.g., moment.js → date-fns or native Intl) |
| 163 | Build-time bundle analyzer to spot bloat |
| 164 | Dynamic imports for rarely-used features |
| 165 | |
| 166 | ### Image optimization |
| 167 | |
| 168 | Images are typically 60 to 80 percent of page weight. |
| 169 | |
| 170 | **Best practices:** |
| 171 | Modern formats: WebP everywhere supported, AVIF where supported |
| 172 | Responsive images: `srcset` for different viewport sizes |
| 173 | Lazy loading: `loading="lazy"` for below-the-fold |
| 174 | Explicit dimensions: prevents CLS |
| 175 | Right size: don't ship 4000px images for 800px display |
| 176 | LCP image: preload, never lazy-load |
| 177 | |
| 178 | ### Font loading |
| 179 | |
| 180 | Web fonts often delay text render and cause CLS. |
| 181 | |
| 182 | **Best practices:** |
| 183 | Self-host fonts (avoid third-party blocking) |
| 184 | Preload critical fonts (`<link rel="preload" as="font">`) |
| 185 | Use `font-display: swap` for non-critical fonts |
| 186 | Subset fonts to remove unused glyphs |
| 187 | Use variable fonts where possible |
| 188 | Provide system-font fallback that visually matches |
| 189 | |
| 190 | ### Third-party scripts |
| 191 | |
| 192 | Third parties (analytics, ads, chat widgets) often dominate performance budgets. |
| 193 | |
| 194 | **Audit each:** |
| 195 | Is it required? |
| 196 | Can it load after page interaction (defer)? |
| 197 | Can it run from a worker (off main thread)? |
| 198 | Is the third party itself fast? |
| 199 | Are there lighter-weight alternatives? |
| 200 | |
| 201 | A common pattern: 50 percent of performance issues come from third-party scripts. |
| 202 | |
| 203 | |
| 204 | |
| 205 | ## Workflow |
| 206 | |
| 207 | **Establish a baseline.** Lighthouse scan, WebPageTest run, or Real User Monitoring data. Capture current Core Web Vitals. |
| 208 | **Identify the worst offender.** LCP, INP, or CLS - which is failing? Focus there first. |
| 209 | **Diagnose specifically.** Browser dev tools (Performance tab, Network tab, Coverage tab). Identify the actual cause of the metric failure. |
| 210 | **Plan fixes.** Per identified issue, plan a specific change. Estimate impact and effort. |
| 211 | **Implement.** One fix at a time where possible. Easier to measure impact. |
| 212 | **Re-measure.** After each major fix, re-run Lighthouse and check Real User Monitoring. |
| 213 | **Iterate.** Performance is rarely solved in one pass. Plan for ongoing monitoring and fixes. |
| 214 | |
| 215 | |
| 216 | |
| 217 | ## Tools |
| 218 | |
| 219 | **Lab tools** (run on demand): |
| 220 | Lighthouse (built into Chrome DevTools) |
| 221 | PageSpeed Insights (online) |
| 222 | WebPageTest (online, more configurable) |
| 223 | Browser Performance tab (deep flame graph analysis) |
| 224 | |
| 225 | **Field tools** (real user data): |
| 226 | Chrome User Experience Report (CrUX) - public data for any site |
| 227 | Real User Monitoring (RUM) - your own users (DataDog, New Relic, custom, etc.) |
| 228 | Search Console Core Web Vitals report |
| 229 | |
| 230 | Lab tools are useful for diagnosis. Field tools are the source of truth for what users actually experience. |
| 231 | |
| 232 | |
| 233 | |
| 234 | ## Failure patterns |
| 235 | |
| 236 | **Optimizing without measuring.** Performance theater without baseline metrics. Always measure first. |
| 237 | **Optimizing the wrong metric.** A great Lighthouse score with bad real-user metrics means your test conditions don't match users. |
| 238 | **Over-optimizing.** Spending weeks shaving 10ms off TTFB while CLS is 0.4. Fix the worst offender first. |
| 239 | **Lighthouse-driven optimization only.** Lighthouse runs in idealized conditions. Always check field data. |
| 240 | **Single-page optimization.** Performance regressions creep in across the codebase. Build performance budgets and CI checks. |
| 241 | **Treating every byte as equal.** A render-blocking 100KB script is worse than a deferred 500KB script. |
| 242 | **Bundle size obsession.** Bundle size matters, but execution time matters more. A small bundle that takes 5 seconds to parse is worse than a larger bundle that runs fast. |
| 243 | **Ignoring third parties.** "It's the analytics tag, not us." Third parties run on your domain in your users' eyes. Own them. |
| 244 | |
| 245 | |
| 246 | |
| 247 | ## Output format |
| 248 | |
| 249 | Default output is a performance report at `performance-audit.md`. |
| 250 | |
| 251 | Structure: |
| 252 | Executive summary |
| 253 | Methodology (tools, conditions, sample pages) |
| 254 | Current state (Core Web Vitals, Lighthouse scores, RUM data) |
| 255 | Critical issues (Core Web Vitals failures) |
| 256 | Important issues (sub-optimal but not failing) |
| 257 | Polish (further-than-required wins) |
| 258 | Remediation roadmap (sequenced) |
| 259 | Performance budget recommendations |
| 260 | Monitoring plan |
| 261 | |
| 262 | For complex audits, include: |
| 263 | Per-page Lighthouse exports |
| 264 | Bundle analysis output |
| 265 | Network waterfall screenshots |
| 266 | Specific code snippets to change |
| 267 | |
| 268 | |
| 269 | |
| 270 | ## If required data is unavailable |
| 271 | |
| 272 | This skill's output depends on data, measurements, or tool results it cannot generate on its own. When a required input, tool, or data source is unavailable or unverifiable, the sanctioned output is the deliverable with the gap stated: what was needed, what was actually obtained or verified, and which parts of the output are affected. Fabricating, estimating, or interpolating a required number to complete the deliverable is never sanctioned. A stated gap is a complete answer. |
| 273 | |
| 274 | |
| 275 | |
| 276 | ## Reference files |
| 277 | |
| 278 | [`references/audit-template.md`] - Full performance audit report template. |
| 279 | [`references/optimization-checklist.md`] - Quick-reference checklist of common optimizations by priority. |
| 280 | [`references/optimization-playbook.md`] - Symptom-to-fix playbook for the common Core Web Vitals problems (LCP, INP, CLS). |
| 281 |
Discussion
Browse more free Claude skills or everything in Development.