Implement comprehensive observability for service meshes
Service mesh observability
Implement comprehensive observability for service meshes including distributed tracing, metrics, and visualization. Use when setting up mesh monitoring, debugging latency issues, or implementing SLOs for service communication.
---
name: service-mesh-observability
description: Implement comprehensive observability for service meshes including distributed tracing, metrics, and visualization. Use when setting up mesh monitoring, debugging latency issues, or implementing SLOs for service communication.
---

# Service Mesh Observability

Complete guide to observability patterns for Istio, Linkerd, and service mesh deployments.

## When to Use This Skill

- Setting up distributed tracing across services
- Implementing service mesh metrics and dashboards
- Debugging latency and error issues
- Defining SLOs for service communication
- Visualizing service dependencies
- Troubleshooting mesh connectivity
Overview
Complete guide to observability patterns for Istio, Linkerd, and service mesh deployments.
Manual install (npx, ZIP)
Claude Code
npx skills add wshobson/agents --skill service-mesh-observability -g -a claude-codeClaude Code (manual)
mkdir -p ~/.claude/skills && curl -sL https://codeload.github.com/wshobson/agents/tar.gz/4236bb91f839 \
  | tar -xz -C ~/.claude/skills --strip-components=4 agents-4236bb91f839/plugins/cloud-infrastructure/skills/service-mesh-observability
Windows (PowerShell)
New-Item -ItemType Directory -Force "$HOME\.claude\skills" | Out-Null; Invoke-WebRequest "https://m.agentalley.io/zip/ef532588adbc3d1b8db9/service-mesh-observability.zip" -OutFile "$env:TEMP\service-mesh-observability.zip"; Expand-Archive "$env:TEMP\service-mesh-observability.zip" -DestinationPath "$HOME\.claude\skills" -ForceClaude.ai / desktop
Codex, Cursor, other agents
Connects with Agent Alley MCP · agentalley.io/mcp
Files included
SKILL.md2.8 KBreferences/1 file · 7.5 KB
Read the files here
SKILL.md
Show the full text65 lines
Service Mesh Observability
Complete guide to observability patterns for Istio, Linkerd, and service mesh deployments.
When to Use This Skill
- Setting up distributed tracing across services
- Implementing service mesh metrics and dashboards
- Debugging latency and error issues
- Defining SLOs for service communication
- Visualizing service dependencies
- Troubleshooting mesh connectivity
Core Concepts
1. Three Pillars of Observability
┌─────────────────────────────────────────────────────┐
│                  Observability                       │
├─────────────────┬─────────────────┬─────────────────┤
│     Metrics     │     Traces      │      Logs       │
│                 │                 │                 │
│ • Request rate  │ • Span context  │ • Access logs   │
│ • Error rate    │ • Latency       │ • Error details │
│ • Latency P50   │ • Dependencies  │ • Debug info    │
│ • Saturation    │ • Bottlenecks   │ • Audit trail   │
└─────────────────┴─────────────────┴─────────────────┘
2. Golden Signals for Mesh
| Signal | Description | Alert Threshold |
|---|---|---|
| Latency | Request duration P50, P99 | P99 > 500ms |
| Traffic | Requests per second | Anomaly detection |
| Errors | 5xx error rate | > 1% |
| Saturation | Resource utilization | > 80% |
Templates and detailed worked examples
Full template library and detailed worked examples live in references/details.md. Read that file when you need the concrete templates.
Best Practices
Do's
- Sample appropriately - 100% in dev, 1-10% in prod
- Use trace context - Propagate headers consistently
- Set up alerts - For golden signals
- Correlate metrics/traces - Use exemplars
- Retain strategically - Hot/cold storage tiers
Don'ts
- Don't over-sample - Storage costs add up
- Don't ignore cardinality - Limit label values
- Don't skip dashboards - Visualize dependencies
- Don't forget costs - Monitor observability costs
| 1 | |
| 2 | name service-mesh-observability |
| 3 | description Implement comprehensive observability for service meshes including distributed tracing, metrics, and visualization. Use when setting up mesh monitoring, debugging latency issues, or implementing SLOs for service communication. |
| 4 | |
| 5 | |
| 6 | # Service Mesh Observability |
| 7 | |
| 8 | Complete guide to observability patterns for Istio, Linkerd, and service mesh deployments. |
| 9 | |
| 10 | ## When to Use This Skill |
| 11 | |
| 12 | Setting up distributed tracing across services |
| 13 | Implementing service mesh metrics and dashboards |
| 14 | Debugging latency and error issues |
| 15 | Defining SLOs for service communication |
| 16 | Visualizing service dependencies |
| 17 | Troubleshooting mesh connectivity |
| 18 | |
| 19 | ## Core Concepts |
| 20 | |
| 21 | ### 1. Three Pillars of Observability |
| 22 | |
| 23 | |
| 24 | ┌─────────────────────────────────────────────────────┐ |
| 25 | │ Observability │ |
| 26 | ├─────────────────┬─────────────────┬─────────────────┤ |
| 27 | │ Metrics │ Traces │ Logs │ |
| 28 | │ │ │ │ |
| 29 | │ • Request rate │ • Span context │ • Access logs │ |
| 30 | │ • Error rate │ • Latency │ • Error details │ |
| 31 | │ • Latency P50 │ • Dependencies │ • Debug info │ |
| 32 | │ • Saturation │ • Bottlenecks │ • Audit trail │ |
| 33 | └─────────────────┴─────────────────┴─────────────────┘ |
| 34 | |
| 35 | |
| 36 | ### 2. Golden Signals for Mesh |
| 37 | |
| 38 | | Signal | Description | Alert Threshold | |
| 39 | | -------------- | ------------------------- | ----------------- | |
| 40 | | **Latency** | Request duration P50, P99 | P99 > 500ms | |
| 41 | | **Traffic** | Requests per second | Anomaly detection | |
| 42 | | **Errors** | 5xx error rate | > 1% | |
| 43 | | **Saturation** | Resource utilization | > 80% | |
| 44 | |
| 45 | ## Templates and detailed worked examples |
| 46 | |
| 47 | Full template library and detailed worked examples live in `references/details.md`. Read that file when you need the concrete templates. |
| 48 | |
| 49 | ## Best Practices |
| 50 | |
| 51 | ### Do's |
| 52 | |
| 53 | **Sample appropriately** - 100% in dev, 1-10% in prod |
| 54 | **Use trace context** - Propagate headers consistently |
| 55 | **Set up alerts** - For golden signals |
| 56 | **Correlate metrics/traces** - Use exemplars |
| 57 | **Retain strategically** - Hot/cold storage tiers |
| 58 | |
| 59 | ### Don'ts |
| 60 | |
| 61 | **Don't over-sample** - Storage costs add up |
| 62 | **Don't ignore cardinality** - Limit label values |
| 63 | **Don't skip dashboards** - Visualize dependencies |
| 64 | **Don't forget costs** - Monitor observability costs |
| 65 |
Details
- Updated
- Sep 21, 2026
- License
- MIT
- Stars on the repo
- ★ 39,857
- Checked
- Source
- wshobson/agents ↗
- Creator
- wshobson · 179 listings
Similar skills
See all → SkillDiagnose why a specific ad creative is winning or losingCreative performance analysis
 gmmh1/claude-paid-media-skills · by gmmh1Diagnose why a specific ad creative is winning or losing using the generalized hook-hold-click-convert funnel, applicable across any platform. Triggers on 'why is this ad underperforming', 'diagnose my creative', or 'where in the funnel is this ad failing'. Platform-agnostic diagnostic framework — platform-specific versions (meta-ads-creative-analytics) apply this with platform-native metrics.New listing
 PromptAct as a professional full-stack developer taskedProfessional Full-Stack Developer for Network Mapping & Monitoring Application
 f/prompts.chat · by Yohanes Farly RakinaungAct as a professional full-stack developer tasked with building a web application for mapping and monitoring networks using Mikrotik Netwatch API. Implement multi-user role-based management to handle devices, monitor their status, and manage user subscriptions.New listing
 SkillEstablishes a project's quality bar as a written contractConstraint driven development
 addyosmani/agent-skills · by addyosmaniEstablishes a project's quality bar as a written contract and stops agents quietly lowering it. Interviews the user on which dimensions matter, supplies sane default thresholds when they have no number in mind, records everything in CONSTRAINTS.md, and watches the diff for a weakened bar — new @ts-ignore or eslint-disable suppressions, skipped or deleted tests, assertions stripped out, unimplemented stubs, thresholds edited down. Use when no quality bar is written down, when the user says "set up constraints" or "define our standards", when the user wants dimensions they care about — accessibility, web performance, coverage — set up as enforced constraints, when an agent keeps silencing checks or skipping tests to get to green, when you need a coverage or performance threshold and don't know what number to pick, or when an agent writes more code than anyone will read.★ 98.7k GitHub stars
 SkillInstruments code so production behavior is visibleObservability and instrumentationaddyosmani/agent-skills · by addyosmaniInstruments code so production behavior is visible and diagnosable. Use when adding logging, metrics, tracing, or alerting. Use when shipping any feature that runs in production and you need evidence it works. Use when production issues are reported but you can't tell what happened from the available data.★ 98.7k GitHub stars
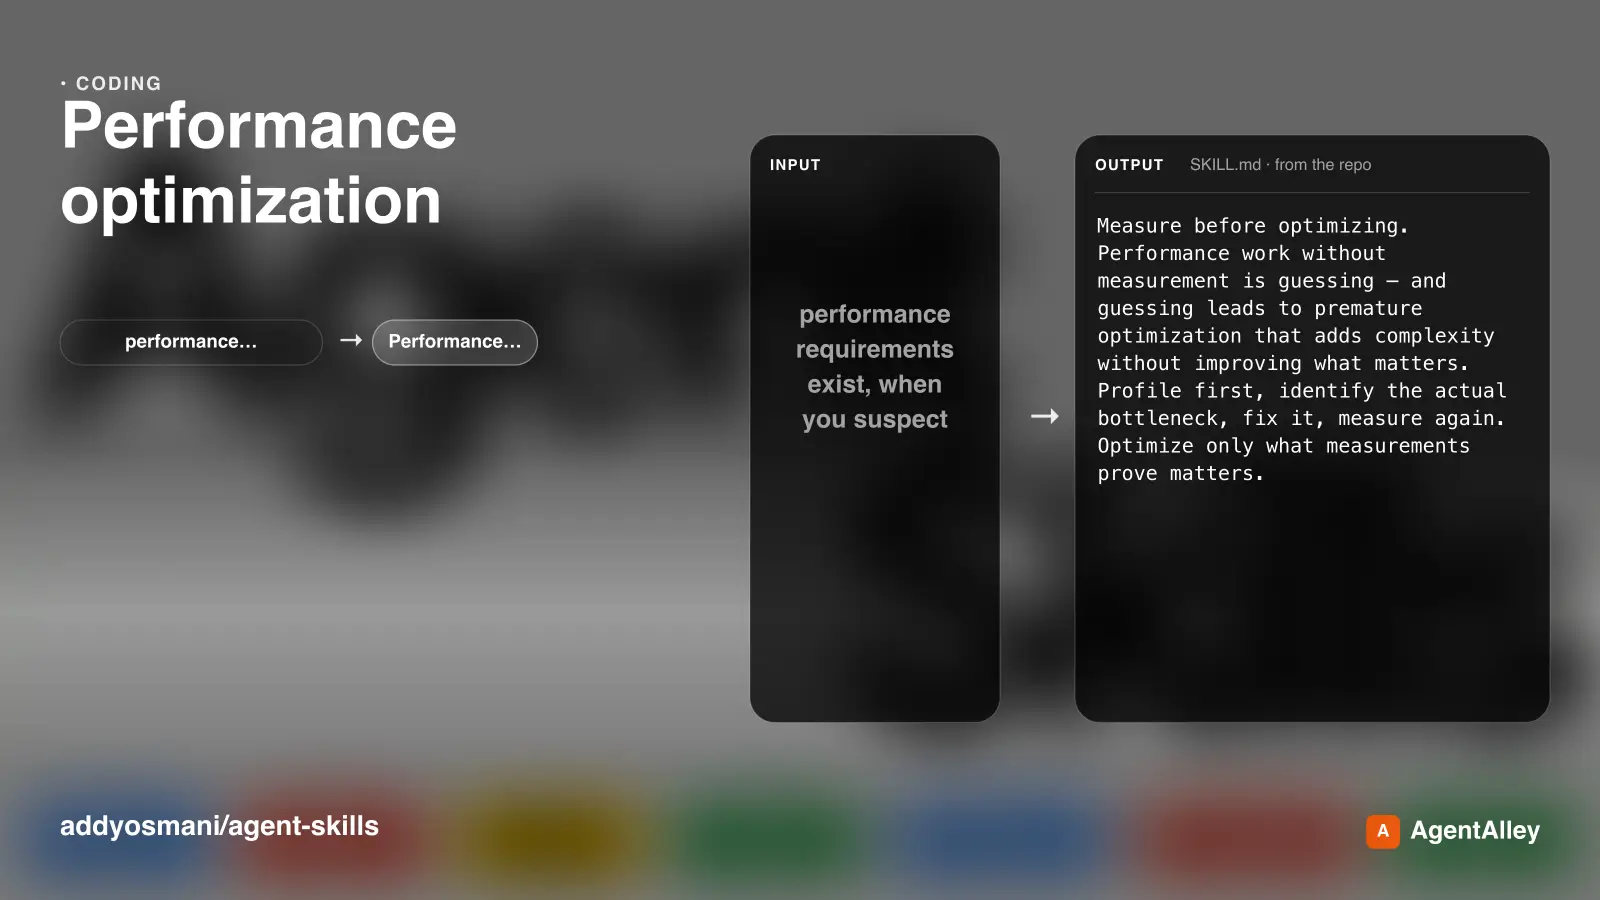 SkillOptimizes application performance across frontend, backendPerformance optimizationaddyosmani/agent-skills · by addyosmaniOptimizes application performance across frontend, backend, queries, and databases. Use when performance requirements exist, when you suspect performance regressions, when Core Web Vitals or load times need improvement, when N+1 query patterns need fixing, or when profiling reveals bottlenecks.★ 98.7k GitHub stars
 SkillDiscovers and invokes agent skillsUsing agent skillsaddyosmani/agent-skills · by addyosmaniDiscovers and invokes agent skills. Use when starting a session, or when you need to decide which skill or workflow applies to the piece of work at hand. This is the meta-skill that governs how all other skills are discovered and invoked.★ 98.7k GitHub stars
More from wshobson
 SkillMaster C/.NET backend development patterns for building
 wshobson/agents · by wshobsonMaster C#/.NET backend development patterns for building robust APIs, MCP servers, and enterprise applications. Covers async/await, dependency injection, Entity Framework Core, Dapper, configuration, caching, and testing with xUnit. Use when developing .NET backends, reviewing C# code, or designing API architectures.★ 39.9k GitHub stars
 SkillImplement WCAG 2.2 compliant interfaces with mobileAccessibility compliancewshobson/agents · by wshobsonImplement WCAG 2.2 compliant interfaces with mobile accessibility, inclusive design patterns, and assistive technology support. Use when auditing accessibility, implementing ARIA patterns, building for screen readers, or ensuring inclusive user experiences.★ 39.9k GitHub stars
 SkillMaster Material Design 3 and Jetpack Compose patternsAndroid Mobile Designwshobson/agents · by wshobsonMaster Material Design 3 and Jetpack Compose patterns for building native Android apps. Use when designing Android interfaces, implementing Compose UI, or following Google's Material Design guidelines.★ 39.9k GitHub stars
 SkillMigrate from AngularJS to Angular using hybrid modeAngular migrationwshobson/agents · by wshobsonMigrate from AngularJS to Angular using hybrid mode, incremental component rewriting, and dependency injection updates. Use when upgrading AngularJS applications, planning framework migrations, or modernizing legacy Angular code.★ 39.9k GitHub stars
 SkillUnderstand anti-reversing, obfuscationAnti reversing techniqueswshobson/agents · by wshobsonUnderstand anti-reversing, obfuscation, and protection techniques encountered during software analysis. Use this skill when analyzing malware evasion techniques, when implementing anti-debugging protections for CTF challenges, when reverse engineering packed binaries, or when building security research tools that need to detect virtualized environments.★ 39.9k GitHub stars
 SkillBuild production Apache Airflow DAGs with best practicesApache Airflow DAG Patternswshobson/agents · by wshobsonBuild production Apache Airflow DAGs with best practices for operators, sensors, testing, and deployment. Use when creating data pipelines, orchestrating workflows, or scheduling batch jobs.★ 39.9k GitHub stars