Infographic / Edu Visual - Handwritten Style 3-Step Process Slide prompt
A prompt for creating a clean, friendly Japanese business slide featuring a 3-step process flowchart with cute illustrations and professional layout.
by AI Guide-Note - 実務で使えるAI活用メディア·CC-BY-4.0 license·via YouMind (CC BY 4.0)·Source ↗
Use now
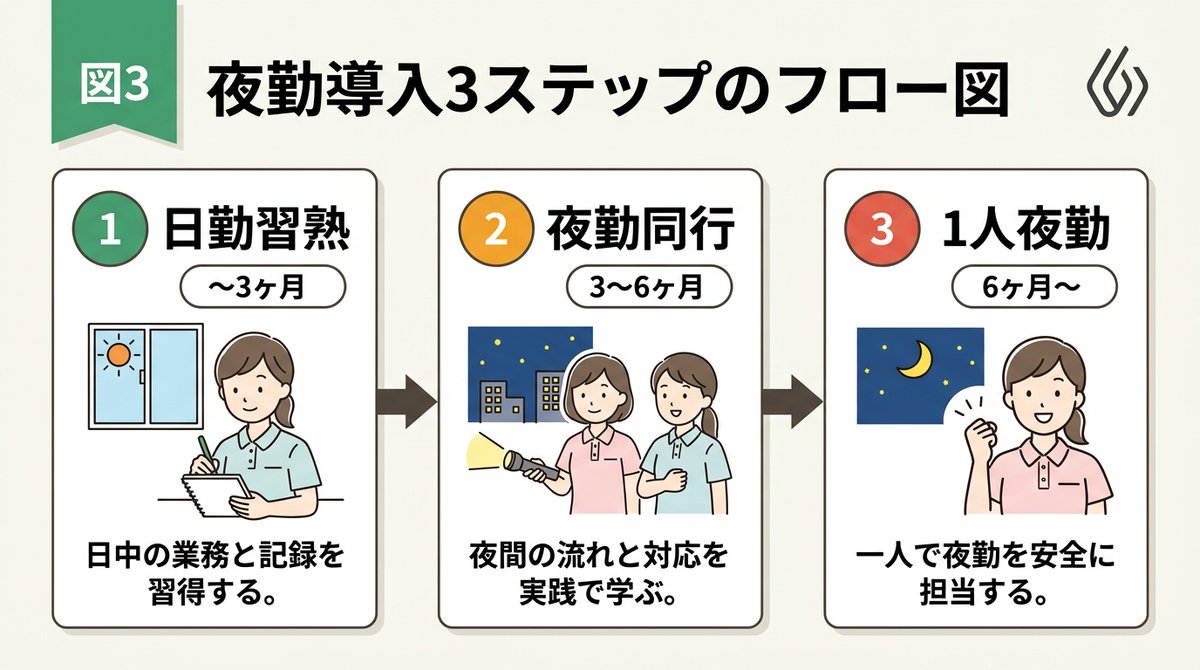
The sample the author posted with this prompt on its sourceview original
| 1 | [Input Data] |
| 2 | - Overall Title: {argument name="main title" default="3-Step Flowchart for Night Shift Introduction"} |
| 3 | - Step 1: Title "{argument name="step 1 title" default="Day Shift Mastery"}" / Period "{step1Period}" / Description "{step1Desc}" |
| 4 | - Step 2: Title "{step2Title}" / Period "{step2Period}" / Description "{step2Desc}" |
| 5 | - Step 3: Title "{step3Title}" / Period "{step3Period}" / Description "{step3Desc}" |
| 6 | - Color Theme: {argument name="color theme" default="green"} |
| 7 | |
| 8 | [Structure and Layout Specifications] |
| 9 | - Style: A clean and friendly 3-step flowchart illustration suitable for Japanese business slides, educational manuals, or internal documents. 16:9 landscape slide configuration. |
| 10 | - Background: Clean off-white or solid white background. |
| 11 | - Top Title: |
| 12 | - Place "Figure 3" or a step badge in the upper left, and to its right, draw a large Japanese main title "{mainTitle}" in a bold, easy-to-read Gothic font. Place a small, clean abstract logo mark at the right edge. |
| 13 | - Step Card Arrangement: |
| 14 | - Three beautiful rectangular cards arranged side-by-side. Placed in order from left to right, connected by thick arrows. Each card border is color-coded neatly according to the color theme ({colorTheme}). |
| 15 | - Card 1 (Left) Interior: |
| 16 | - Draw a circular badge "1" and the Japanese title "{step1Title}" prominently. Below that, a capsule label saying "{step1Period}". |
| 17 | - In the center, place an illustration of a Japanese woman with a gentle hand-drawn touch taking notes, and a window showing the sun. |
| 18 | - At the bottom, place the Japanese description "{step1Desc}". |
| 19 | - Card 2 (Center) Interior: |
| 20 | - Draw a circular badge "2" and the Japanese title "{step2Title}" prominently. Below that, a capsule label saying "{step2Period}". |
| 21 | - In the center, place an illustration of two Japanese women with a flashlight, night sky, and buildings. |
| 22 | - At the bottom, place the Japanese description "{step2Desc}". |
| 23 | - Card 3 (Right) Interior: |
| 24 | - Draw a circular badge "3" and the Japanese title "{step3Title}" prominently. Below that, a capsule label saying "{step3Period}". |
| 25 | - In the center, place an illustration of the night sky and crescent moon, and a Japanese woman smiling with a victory pose. |
| 26 | - At the bottom, place the Japanese description "{step3Desc}". |
| 27 | |
| 28 | [Quality and Font Specifications] |
| 29 | - Simple, clean 2D illustration, flat design, crisp clear line art. |
| 30 | - All text must be accurately drawn in readable Japanese fonts (Gothic) without spelling errors. |
| 31 | - Exclude all 3D effects, shadows, laptop mockup backgrounds, or camera tilt; display the flat diagram itself across the entire screen. |
| 32 | |
| 33 | - Aspect Ratio: --ar 16:9 |
Discussion
Alternatives
 Visual explainerGenerate self-contained HTML visual explanations for systems, code changes, plans, data, and technical concepts. Use for diagrams, architecture overviews, diff or plan reviews, project recaps, comparison tables, slide decks, animated explainers, and other visual explanations.
 PR LensWHAT: Draws a code change or part of a codebase as an animated architecture or data-flow diagram, on its own or in a pull request. WHEN: asked to diagram, visualise or explain a change or a system, or when a pull request should carry a diagram. KEYWORDS: PR Lens, diagram, architecture, data flow, visualise, visualize, pull request
 ReladrawWrite, render and edit diagrams in reladraw, a text diagram language where you say where things go, so the arrangement can be read back out of the source without looking at the picture. Use when asked to draw, diagram, sketch or visualize an architecture, a system, a data flow, a pipeline, a deployment, a directory layout, or the shape of a change or pull request; when reading or editing a .reladraw file; or when the user says "reladraw", "diagram this", "draw the architecture", "show me how these pieces fit". Use it in place of Mermaid, Graphviz, D2 or hand-drawn ASCII boxes whenever a node-and-line diagram is wanted and reladraw is installed. NOT for charts of data — bar, line, pie, scatter — and NOT for pictures that are not nodes and lines.
 Core scenarios (what this skill handles)Design or redesign frontend UI, presentations, and graphics on the Superdesign canvas with a choice of leading AI models. Use whenever the user wants to design a page, feature, flow, slide deck, or brand-new product; improve or reproduce existing UI; compare design results across top models; explore visual variants; set or extract a design system; build reusable components or multi-page flows; create presentations; or create posters and marketing graphics, even if they never say the word 'design tool'. Also supports generating supporting image or video assets when a design needs them.
Browse more free AI prompts or everything in Design.